


Natural Gas Technical Outlook
- Stalled Bearish momentum
- Nat gas price, Signals and Levels to consider
Natural Gas – Bears Hold Fire
On Friday, natural gas rebounded from its lowest level in two weeks at $1.816 then closed the weekly candlestick in the red with 1.1% loss. This week, the market opened with a gap to the upside then rallied as some shorts seemed to cover.
Last week, the Relative Strength Index (RSI) remained flat below 50 highlighting paused downtrend momentum.
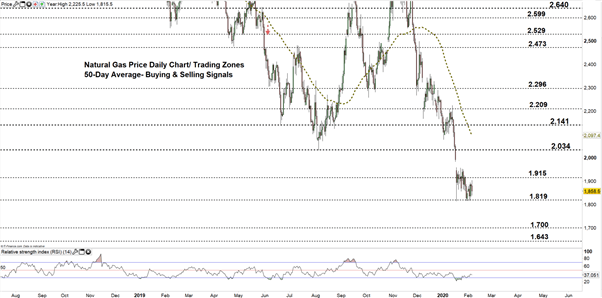
Nat-Gas DAILY Price CHART (JUL 15, 2018 – FEB 6, 2020) Zoomed Out

Nat-Gas DAILY Price CHART (Nov 27 – FEB 6, 2020) Zoomed IN
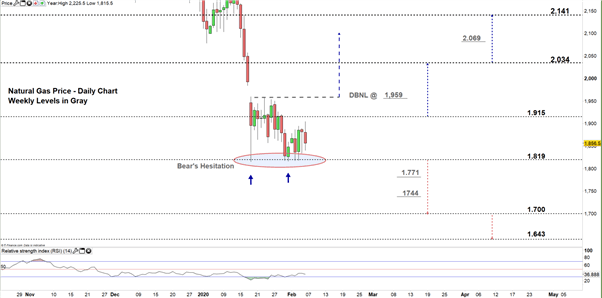
Looking at the daily chart, we notice on Jan 27 natural gas reversed to a lower trading zone $1.819 - $1.915. Later, the price rebounded in multiple times around the low end of the zone reflecting bear’s hesitation.
A close below the low end may end this hesitation and encourage bears to press towards $1.700. Further close below this level could cause more bearishness towards $1.643. That said, the weekly support levels underlined on the chary (zoomed in) should be considered.
In turn, a close above the high end of the zone could lead some bears to exit the market. This may send the price towards $2.034. Additionally, any break above the neckline of double bottom pattern located at $1,959 could cause a rally towards $2.069.

Natural Gas price Four-Hour PRICE CHART (DEC 29 – FEB 6, 2020)
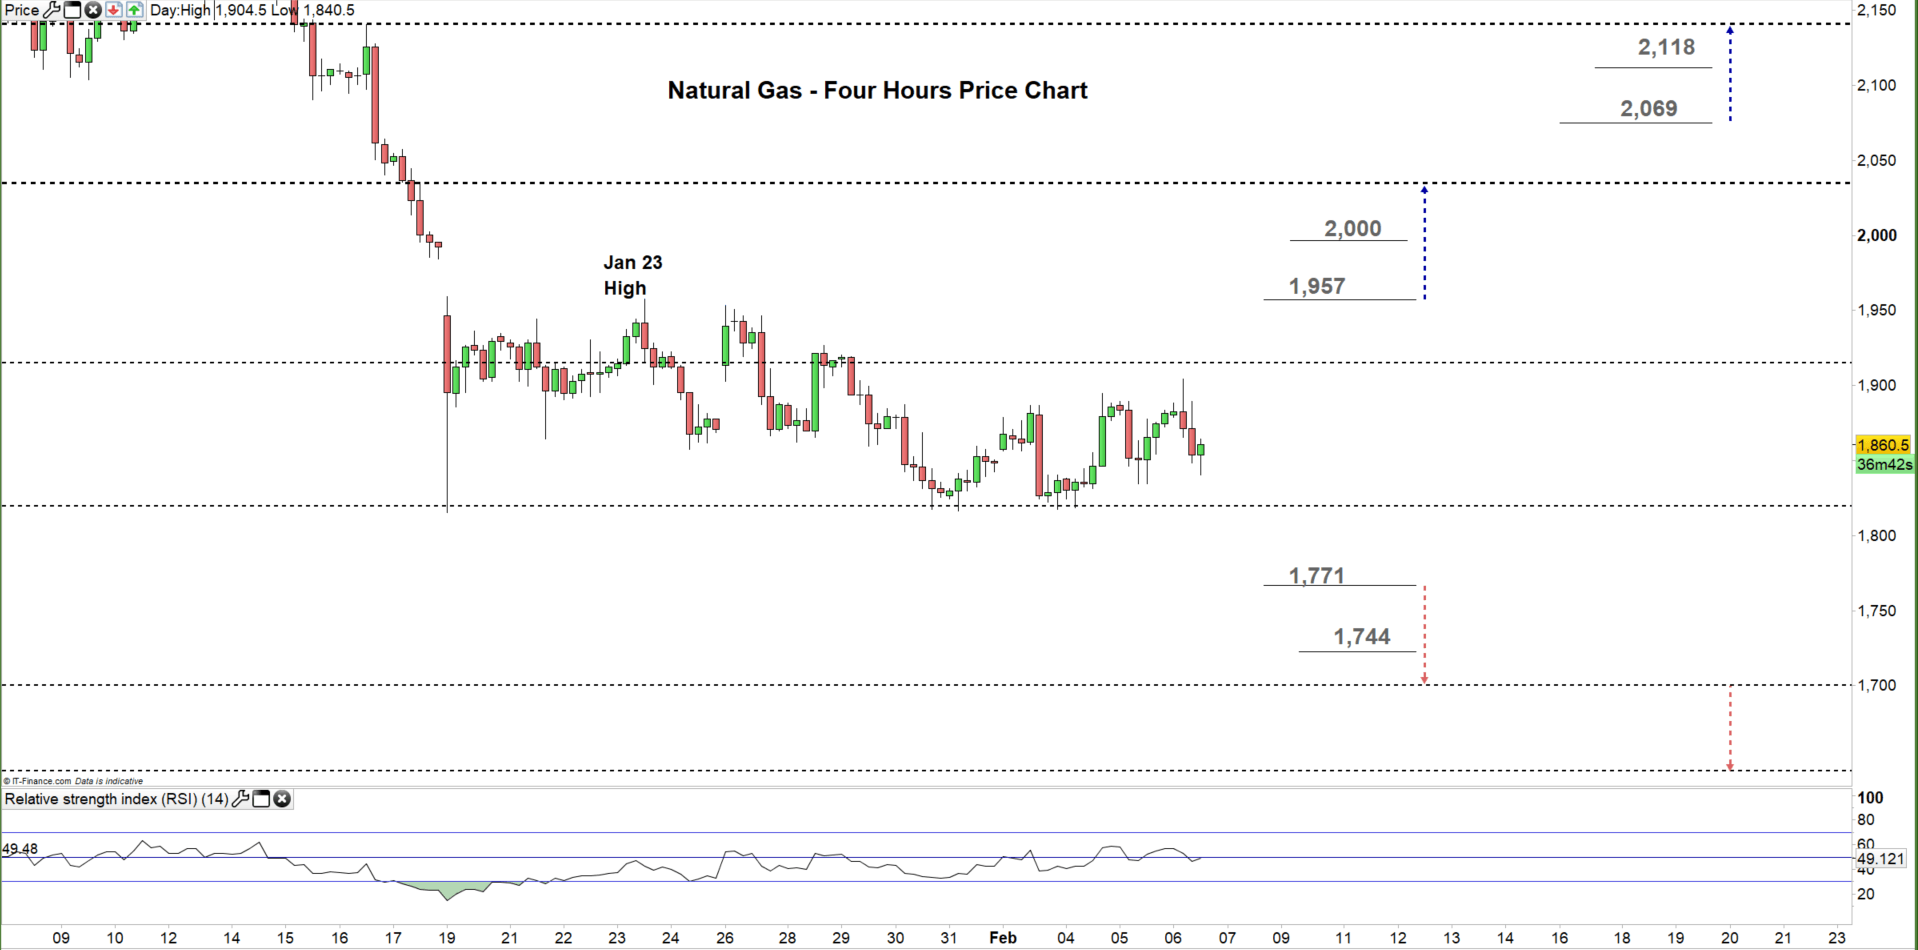
From the four- hour chart, we noticed on Jan 19 natural gas printed $1.815- its lowest level in nearly four years. Since then, the markrt stuck in sideways move.
A break above the Jan 23 high at $1.957 could cause a rally towards $2,034. Although, the psychological resistance level at $2.000 should be watched closely. On the flip side, a break below $1.771 may resume bearish price action towards $1.700. Nevertheless, the weekly support level underscored on the chart would be worth monitoring.
Written By: Mahmoud Alkudsi
Please feel free to contact me on Twitter: @Malkudsi


