


US crude oil is not simply biding its time amid more active conditions in the broader financial system. The commodity continues to exhibit significant realized volatility and has played out 10 to 15 percent swings in one to two week clips. Yet a decisive trend remains allusive.
US Oil Technical Forecast Talking Points:
- WTI crude’s generally bullish trend over the past two years is seeing more consolidation in the past two months than anything experienced since the market’s going negative
- Realized volatility remains extremely high for the commodity with the rolling 20-day ATR still hovering around the $5 per day range
- I consider 115 and 100 to be important technical boundaries to real trends, with three-year lows in COT net long interest showing a speculative bias

Technical Forecast for US Crude Oil: Neutral
The fundamental charge around crude oil is difficult to shed, even as the market grows acclimatized to its influence on the supply-demand mix. Russia’s invasion of Ukraine continues, and the Western world in turn continues to press the sanctions on the aggressor – thereby pressuring the global supply of the necessary resource. And yet, prices for the raw material have no been progressing to new highs. Perhaps one sided pressure is being offset by the decline in growth forecasts (China and he rest of the world), but technicians are focusing on the charts to see when the balance finally breaks one way or the other. There is a broad range forming with the double top jus above 115 and the combination of rising trendline support with the 100-day SMA around 100. Even volatile day-to-day activity will likely be cut short until we can clear one of these two barriers. A move higher would follow the prevailing trend, but a break lower would likely be the more loaded technical resolution. Either way, the level of persistent volatility is creating pressure with the narrow band with which his market is moving. In other words, we are working our way towards an eventual breakout/down. The question is whether it will happen this week or later.
Chart of US Crude Oil with Volume and the 20,100-Day SMAs, 20-Day ATR and 50-Day Range (Daily)
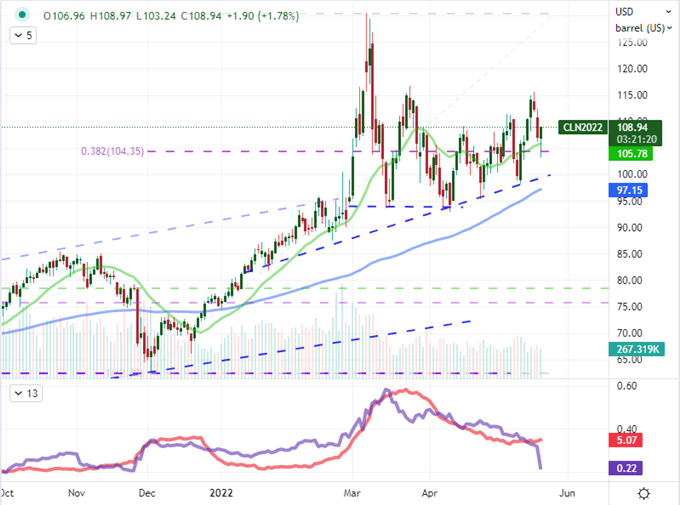
Chart Created on Tradingview Platform
When it comes to the daily chart of WTI crude, there remains a bullish bias, but I think it is important to point out the larger technical considerations. While we still have an upside projection up to 130 should the 115 double top break, I don’t think this represents much room to run for intentional drive. Alternatively, a break lower that slowly turns the rend is no likely to translate into a persistent trend. This looks much more likely a market that will abide by technical boundaries with test/pause/break stages. While most seek out the direction of an eventual break, I think the volatility of the market is the hallmark and the range makes for a more practicable approach. Consider the ‘wicks’ on the weekly chart of oil whereby some of he larger upper and lower ‘tails’ on this time frame back well before the 2008 crisis and raises my assumption that a systemic move is possible.
Chart of US Crude Oil with Volume and Wicks (Weekly)
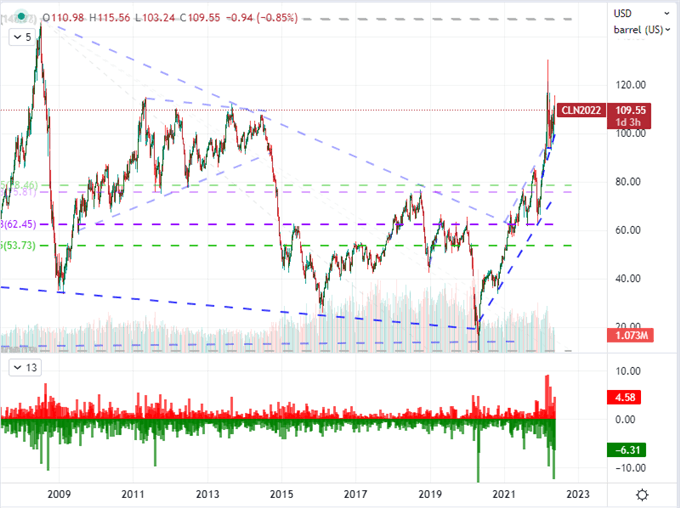
Chart Created on Tradingview Platform
While we await the speculative ranks’ resolution on crude oil it is worth highlighting out the traders are leading. Using the CFTC’s Commitment of Traders (COT) report, there has been a significant push against the advance over the past few years. In fact, net speculative futures positions has dropped to meet lows stretching back to late 2018. I will say that speculative interests can often be off base as there is an appetite for convenience in patterns. That said, it seems that market’s propensity for volatility without commitment is well founded. Just keep tabs on those outer technical bounds.
| Change in | Longs | Shorts | OI |
| Daily | 5% | 0% | 3% |
| Weekly | 37% | -31% | 13% |
Chart of US Crude Oil Futures Overlaid with Net Speculative Futures Positioning (Weekly)
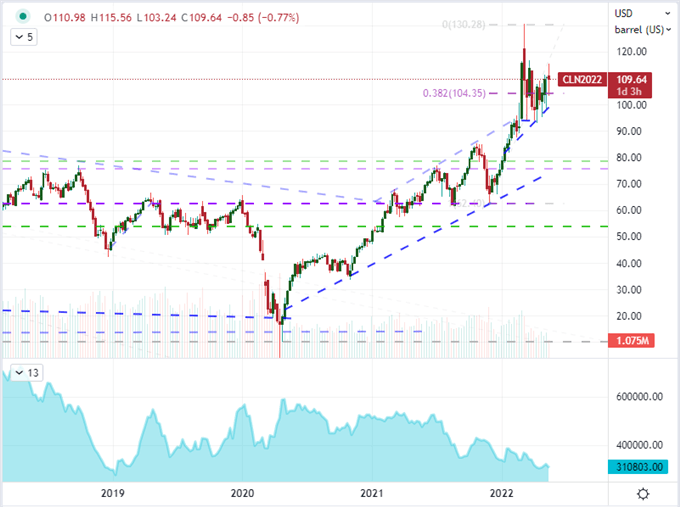
Chart Created on Tradingview Platform


