

The U.S. stock market, and most of the world for that matter, remains pointed higher until it indicates otherwise through price action that suggests a broad correction or worse is unfolding. For the S&P 500, a decline below 4495 would be noteworthy as it would be the first lower-low we have seen in some time.
It may just mean a corrective pattern is forming that won’t last long, but it would certainly be worth monitoring closely for bear market conditions to extend. The 200-day moving average would be the next big level to watch if support breaks, it currently resides around 4370 (and rising).
On the top-side, should we see no break in support levels and the trend remain status quo, then new record territory would bring no resistance to speak of. We would need to monitor momentum and price action for cues as to when another meaningful high may develop on the market’s own weight. Should the market traverse in record territory, traders will want to be cautious on chasing as the market has a tendency to reverse prior weeks gains at new highs before resuming. The bottom line is buying the dip tends to yield better results than chasing momentum.
S&P 500 Weekly Chart
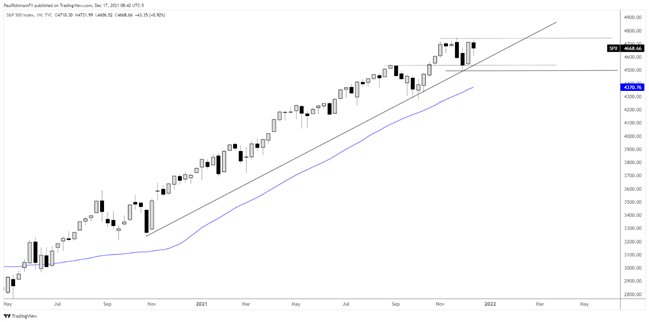
Chart created with TradingView
DAX
It is possible the DAX is working on a broadening top, a pattern marked by higher-highs coupled with flat bottom lows. If this pattern were to come to roost it could be significant as it has been under development since April. To validate the pattern a decline below 14818 is needed. In the event it does trigger, the next major level to watch is the high prior to the pandemic set at 13795.
Bearish patterns, though, in the ongoing bull market have not been very reliable. And on that, we may not see the broadening top trigger. If we see a bid maintain and U.S. equities (the leader) continue to be neutral to strong, then the DAX is likely to follow suit to some degree. If we see a rally to new record highs beyond 16290, keep an eye on the top of the broadening top pattern as it could put in yet another peak to concern ourselves with.
DAX Weekly Chart
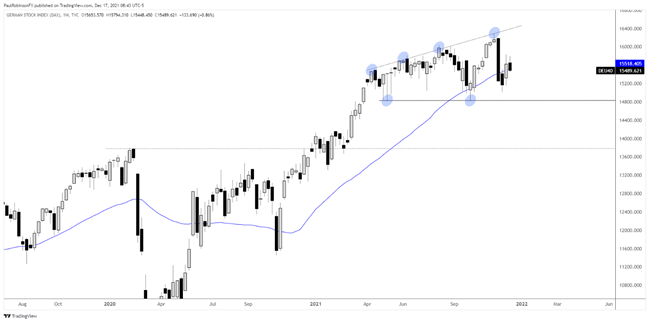
Chart created with TradingView
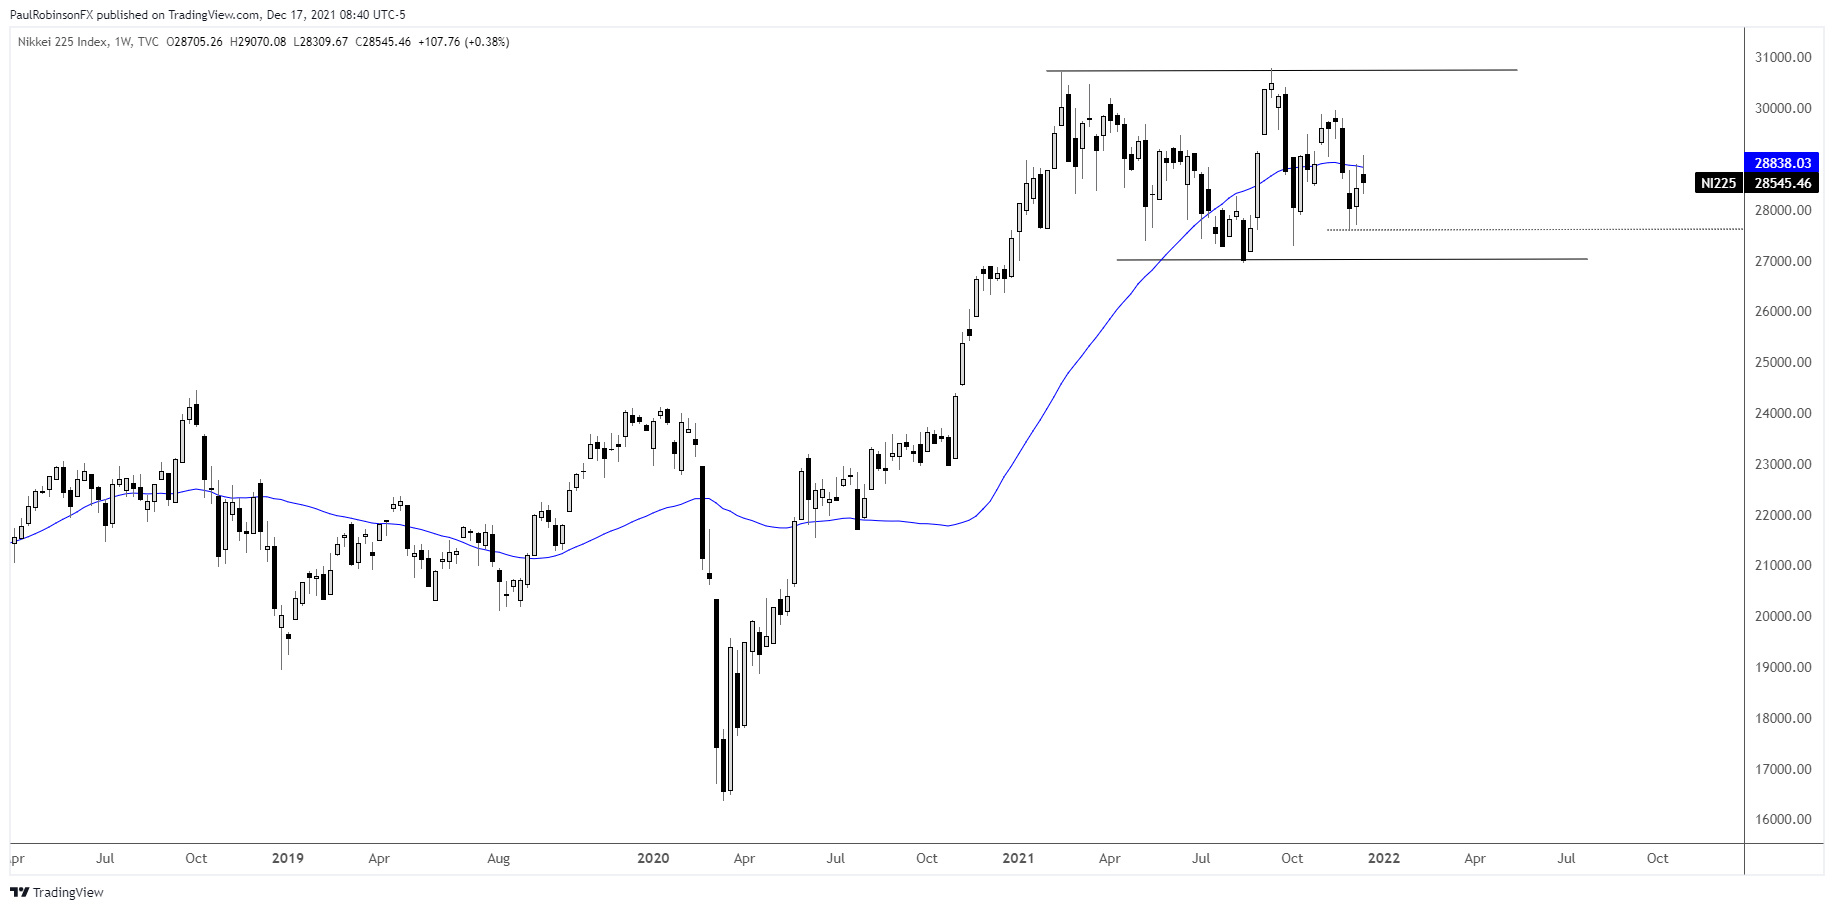
NIKKEI 225
The Nikkei was been stuck in idle for all of 2021. It is in the process of creating a range that may extend well into or through the first quarter of 2022. On the downside the bottom of the range is 26954, viewed as the first truly meaningful level of support. A break below could set off a large move lower as it may prove a major top had formed in 2021. On the top-side, there is minor intra-range resistance at 29960, but the real concern is the high at 30795. A break of this level is needed to extend the bull market.
Nikkei 225 Weekly Chart