


Canadian Dollar Technical Forecast: Bullish
- The commodity currency (CAD) continues gains vs USD and weaker Yen
- Mixed USD/CAD client sentiment reading despite over 70% net long positioning

CAD Backed by Slow and Consistent Rise in Oil Prices
The Canadian dollar shows plenty of promise over the next week as oil price charts continue to grind higher and the US 10 year treasury yield attempts to stop the decline, much like the US dollar. Additionally, with the national elections in the rear-view mirror for some time now, Loonie price action possesses the potential to trade with less noise.
The USD/CAD daily chart shows the zone of resistance between 1.290 and 1.2950 (red) preventing further bullish momentum, ultimately resulting in an prolonged move of lower USD/CAD price movement. A definitive breakdown below trendline support confirmed the bearish reversal which has only gained momentum over the last week.
USD/CAD Daily Chart

Chart prepared by Richard Snow, IG
Looking at the weekly chart, it is clear to see that the 38.3% Fib level (2020 high – 2021 low), loosely coinciding with the 1.3000 psychological level proved too great for USD/CAD bulls. Since then, USD/CAD moved through the 23.6% level at 1.2634 and now has 1.2220 in sight.
USD/CAD Weekly Chart
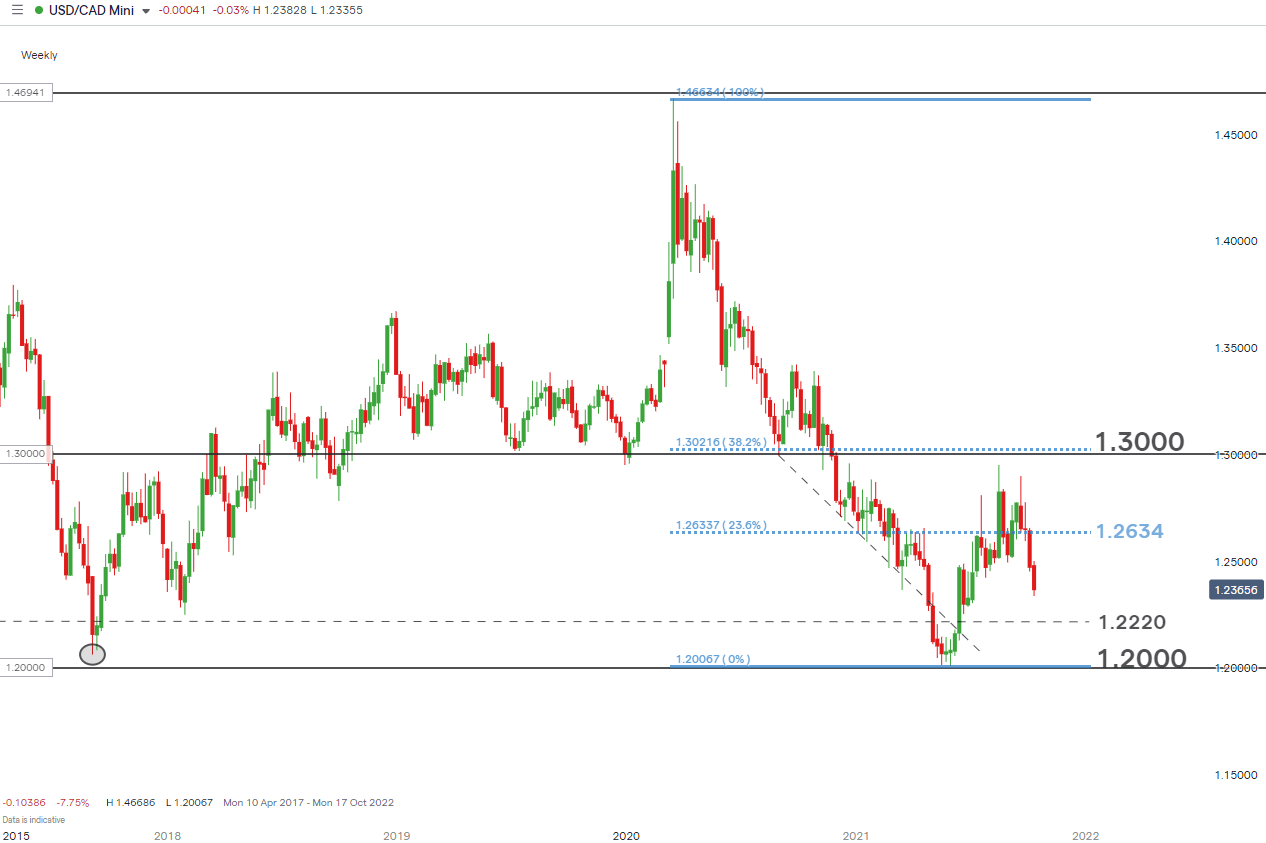
Chart prepared by Richard Snow, IG
Mixed USD/CAD Sentiment Despite over 70% Net-long Positioning
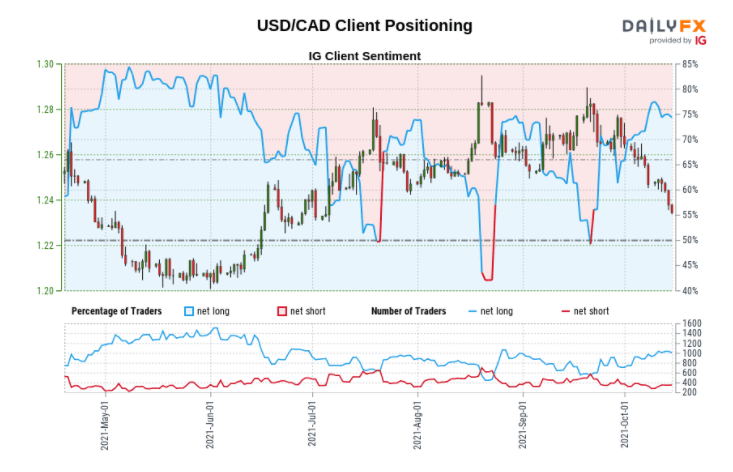

- USD/CAD: Retail trader data shows 71.57% of traders are net-long with the ratio of traders long to short at 2.52 to 1
- We typically take a contrarian view to crowd sentiment, and the fact traders are net-long suggests USD/CAD prices may continue to fall.
- The number of traders net-long is 2.96% higher than yesterday and 0.31% lower from last week, while the number of traders net-short is 1.53% lower than yesterday and 6.03% higher from last week.
- Positioning is more net-long than yesterday but less net-long from last week. The combination of current sentiment and recent changes gives us a further mixed USD/CAD trading bias.
‘Weak vs Strong’ Analysis: JPY vs CAD
Both the CAD/JPY and EUR/CAD charts reflect the same narrative of a strong commodity linked currency with a more hawkish central bank, weighed up against a weaker currency with a more accommodative central bank. This becomes relevant as the rates market currently suggests a Canadian rate hike by the end April next year while the Bank of Japan is a long way from even mentioning a potential hike.
Bank of Canada Interest Rate Expectations
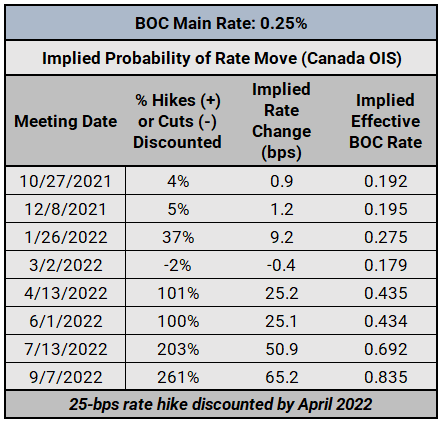
Credit: Christopher Vecchio via Central Bank Watch
However, it is the CAD/JPY chart that deserves closer attention as the current advance places it comfortably above the recent and prior significant highs. For a while, technical traders may have been anticipating the formation of a head and shoulders reversal pattern but this proved to be incorrect as successive weekly surges laid waste to that narrative.
The current bullish advance has shown little sign of slowing down, however a short term pullback towards the (90.50 – 91.10) zone of support should not be discounted. This area provided multiple inflection points in the past and remains a key zone for a bullish continuation. Failure to remain above the zone of support for the week ahead could suggest a slow down and potential deeper pullback towards 88.80 – a point at which the bullish narrative would need to be re-assessed.
CAD/JPY Weekly Chart

Chart prepared by Richard Snow, IG
--- Written by Richard Snow for DailyFX.com
Contact and follow Richard on Twitter: @RichardSnowFX


