


Gold Technical Forecast Talking Points:
- Gold dropped to its lowest level since the beginning of August this past week, but was up on the week
- A descending channel over the past three months sets the immediate technical levels of import
- Keep close track of the level of volatility and health of fiat assets as motivation for the alternative
What do the DailyFX analysts expect for the Euro through the fourth quarter of 2019? What about the other majors, indices and commodities? Download our free Q4 Forecasts - Fundamental and Technical on the DailyFX Free Trading Guides Page.
Technical Forecast for Gold: Bullish
On the back of the biggest single-week tumble in three years, gold managed to pull out of its dive this past week for a positive close. This would effectively cut off what could otherwise be construed as a break into a free-fall bear trend. There were significant technical support levels that were cleared through the first half of November that could have hit the accelerator on a lurking speculative hunt. The range low in 1,475 established through much of October and the swing low set at beginning of last month at 1,459 were both distinctly overtaken. There are additional levels of chart-based support that followed these milestones, but I don’t believe it was the weight of this figures that culled the run. Rather, this is more commensurate to the general lack of conviction that we have seen across the market. Be cautious of tentative breaks and take advantage of ranges when they appear.
Taking a look at the daily chart of gold prices below, we can see the conditions we are dealing with. The past three months have been defined by a descending trend channel that draws substantial contrast to the productive bull trend that preceded it the three months prior. This creates a ‘pennant’ formation that is usually a continuation pattern. I will not take the textbook’s reading on that perspective however. The more significant technical levels to account for on this time frame are the confluence around 1,450 but also the 1,410 level that represents the convergence of the 200-day moving average and the mid-point of the June to September bull leg. To the upside, breaking the drift that now finds cap at 1,500 then leads to the multi-year high from early September just shy of 1,560.
Chart of Gold with 200-Day Moving Average (Daily)
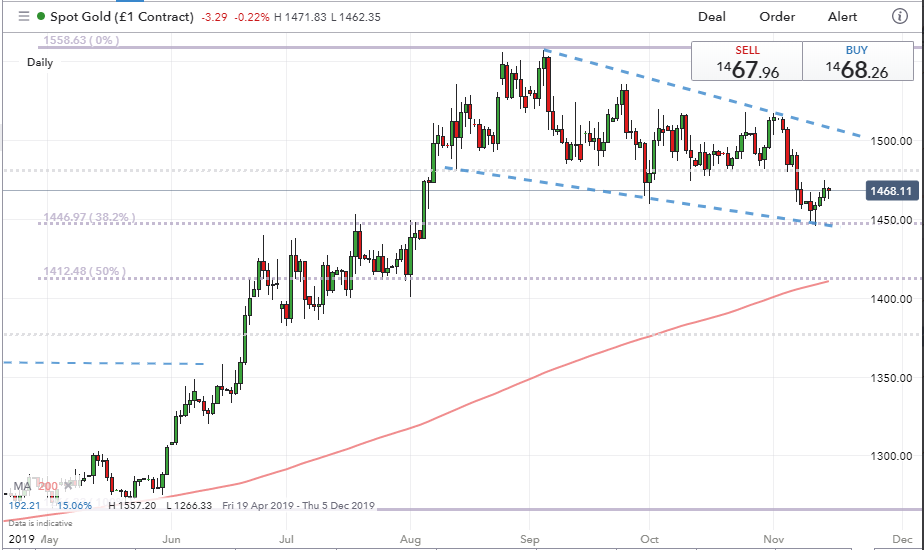
Chart created with the IG Trading Platform
To fully understand the type of conditions we are dealing with at the moment, it is worth considering the graveyard of technical reversal opportunities that failed to materialize over the past three months. It started with the September tumble that could have set a ‘V-top’ only to then turn into a head-and-shoulders pattern. We broke that reversal pattern’s ‘neckline’ support at the very end of September, and it stalled before it even gained purchase. A trendline support from July to the beginning of November was broken in what was the that biggest weekly tumble in three years, but pace sputtered as we trickled below a range low (triple bottom) at 1,460. There were in other words, plenty of opportunities to inspire bears if they were really motivated. Perhaps they are not.
Chart of Gold with 200-Day Moving Average (Daily)

Chart created with the IG Trading Platform
Heading into the new trading week, we are trading against a confluence of noteworthy technical levels as support. The midpoint of the past six-months’ range happens to fall in line with the current floor of the descending trend channel back to the beginning of August at approximately 1,450. This past week offered up a short-term double top that meets the November range’s 38.2% Fib at 1,473. This figure has little weigh in my book. More noteworthy would be the midpoint of that same stretch and the previous support-as-new-resistance at 1,480. The top of the channel could be reached if volatility picks up materially.
Chart of Gold (4-Hour)
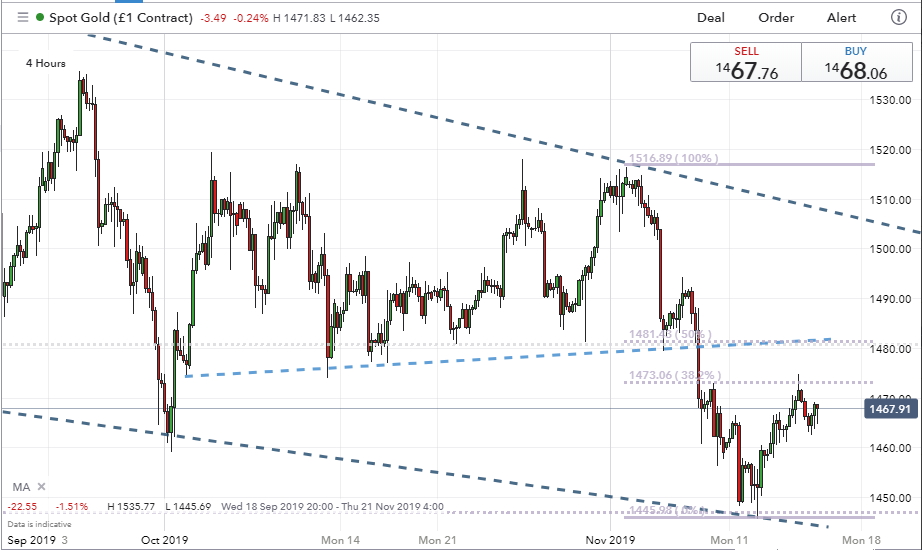
Chart created with the IG Trading Platform
In portfolios, gold still enjoys an important place as a have asset to offset the mix of riskier assets that are increasingly over-inflated through conviction based in external influences like stimulus. General market volatility – like that shown through the VIX – is exceptionally low. There isn’t much further that it can drop which may limit the contribution of intensity to gold selling. On the other hand, the GVZ gold volatility index from the CBOE is still falling rapidly. That hasn’t pulled spot down with it however. If either of these activity measures – and especially if both – were to rise, gold is more likely to channel the movement in price action. In other words, there is more potential for a strong charge than a strong drop through this relationship.
Chart of Gold with GVZ Gold Volatility Index (Daily)
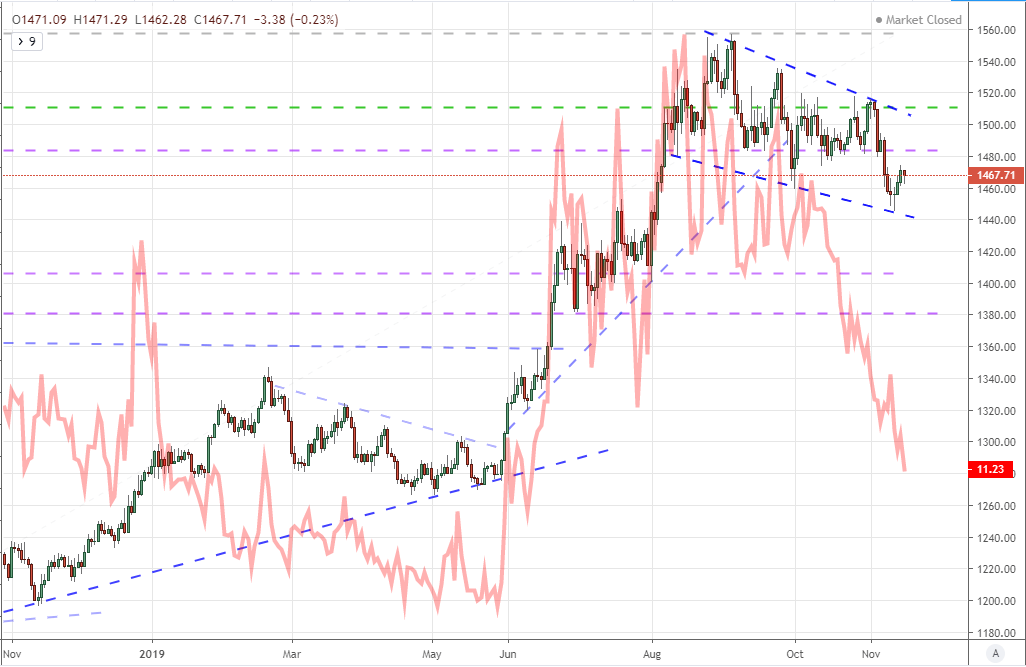
Chart created with the TradingView Charting Platform
The other correlation I am watching very closely for the metal is to representations of the financial system. Most appreciate the relationship that gold holds to the Dollar as a principal pricing currency. However, the relationship runs deeper than that. The Greenback is the world’s most liquid fiat asset and representative of the financial system. Since we normally price gold in dollars, I feel this isn’t comprehensive enough. Therefore, below we have gold priced in the four chief reserve currencies (Dollar, Euro, Yen, Pound) overlaid with a more elementary financial measure in 10-year government bond yields for the US, UK, Germany and Japan. As you can see in the correlations below (5-day and 20-day) the relationship is strong and negative. If yields drop as financial confidence flounders, gold will likely rise.
Chart of Equally-Weighted Gold Index Overlaid with Major 10yr Yields and Correlations (Daily)
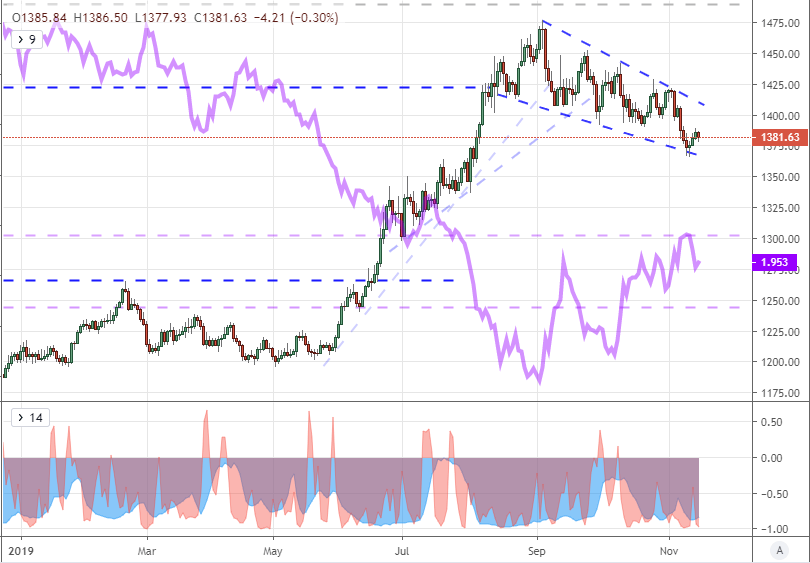
Chart created with the TradingView Charting Platform
See how retail traders are positioned in Gold along with other key FX pairs, indices and oil on the DailyFX Sentiment page.
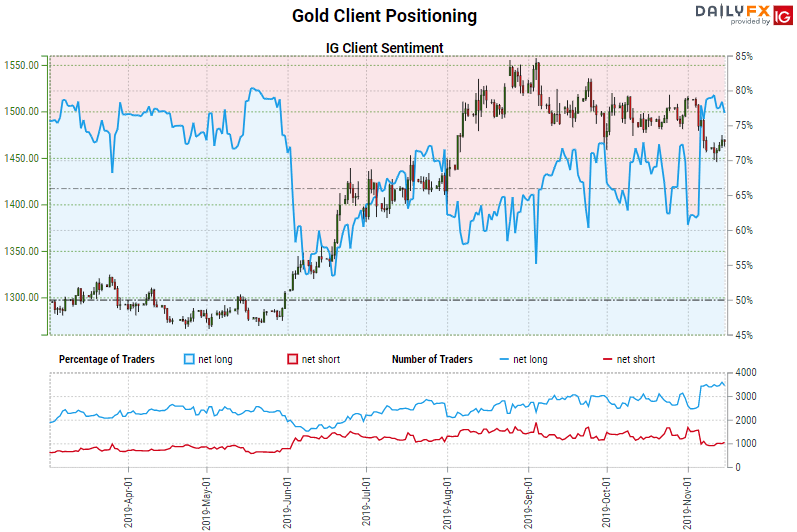
In speculative position, there is a heavier net long view on both the longer and shorter-term. Are these both contrarian readings? In net speculative futures positioning, the near-record long interest is still hosting a perspective that the climb in 2019 is robust with potentially more run to go. In historical reference terms, this is an extreme readings but I wouldn’t consider it an easy prompt for leaning against the prevailing wind. As for the shorter termed retail CFD positioning figures from the IGCS, we have returned to the same levels of net long interest since May – back when the market was significantly lower. This is in part a growing comfort with range conditions, but it does cater to a complacent belief of a default buoyancy. This is a strong contrarian reading that can amplify range swings especially.
Chart of Net Speculative Positioning in Gold Futures from CFTC Report (Weekly)
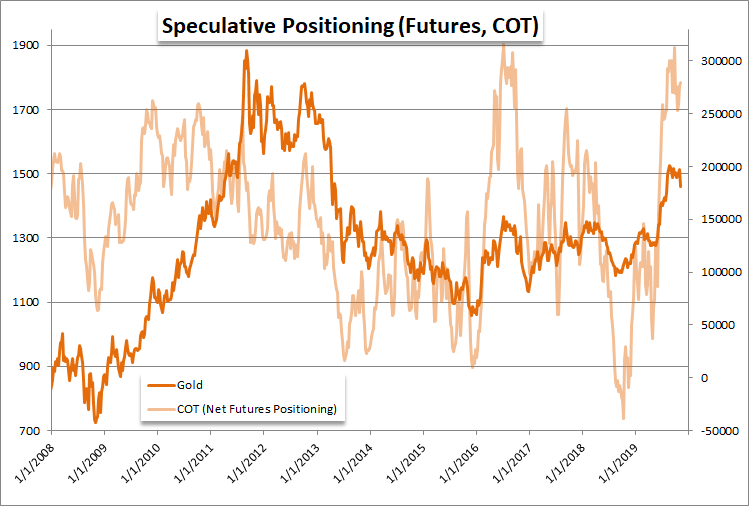
Chart of Retail Trader Positioning from IG Clients (Daily)
.


