


AUDUSD TECHNICAL OUTLOOK - TALKING POINTS
- AUDUSD bears continue to dominate spot price action
- Spot AUDUSD at risk of printing fresh multi-year lows
- Download the free DailyFX educational guide on How to Use Elliott Wave Technical Analysis or find out the top Traits of Successful Traders
Spot AUDUSD tumbled 131 pips this past week following a hard rejection of the 0.7000 handle – a hefty area of resistance which previously served as support back in March and late April. While the Australian Dollar saw weakness against its American counterpart due to fundamental factors like uninspiring Aussie unemployment and upbeat US retail sales data, the long-prevailing bearish technical trend has served quite telling. Since early 2018, spot AUDUSD has churned along a series of lower highs and now looks on its way to print another lower low.
SPOT AUDUSD – CHART 1: WEEKLY TIME FRAME (MARCH 29, 2015 TO JUNE 14, 2019)
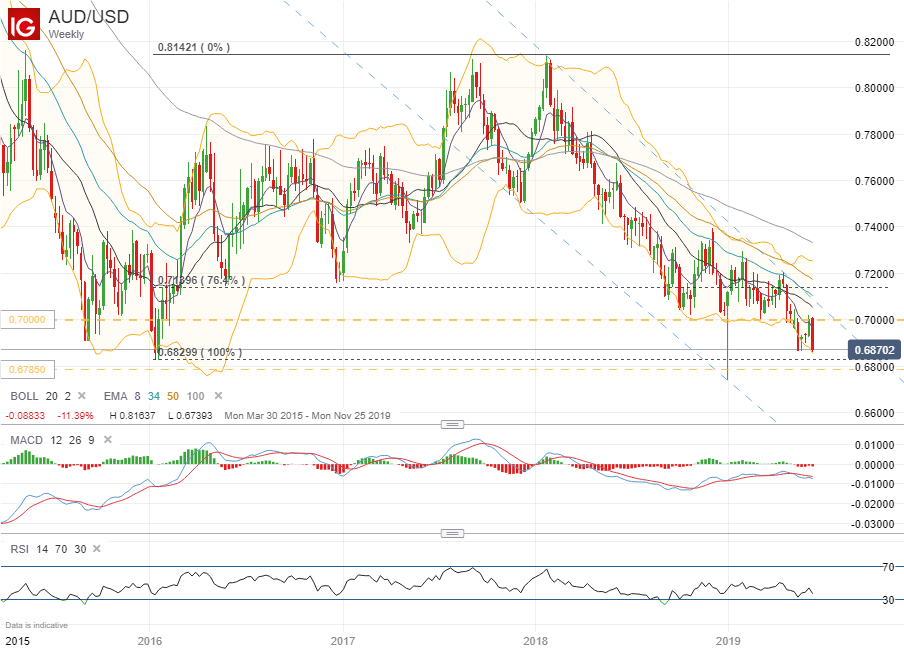
With spot AUDUSD plunging through support at the 0.7000 handle – which has previously served as a major area of confluence – the forex pair appears on its way to reinforce the prevailing bearish downtrend lower. Aside from the bottom printed during the January 2019 flash crash, the January 2016 low of 0.6739 and May 2004 low of 0.67850 could serve as possible downside targets for AUDUSD bears highlighted above in chart 1. Downside could accelerate in particular if the currency rate fails to hold on to Fibonacci support at the 76.4% retracement level where spot prices currently trade shown below in chart 2.
SPOT AUDUSD – CHART 2: DAILY TIME FRAME (NOVEMBER 30, 2018 TO JUNE 14, 2019)
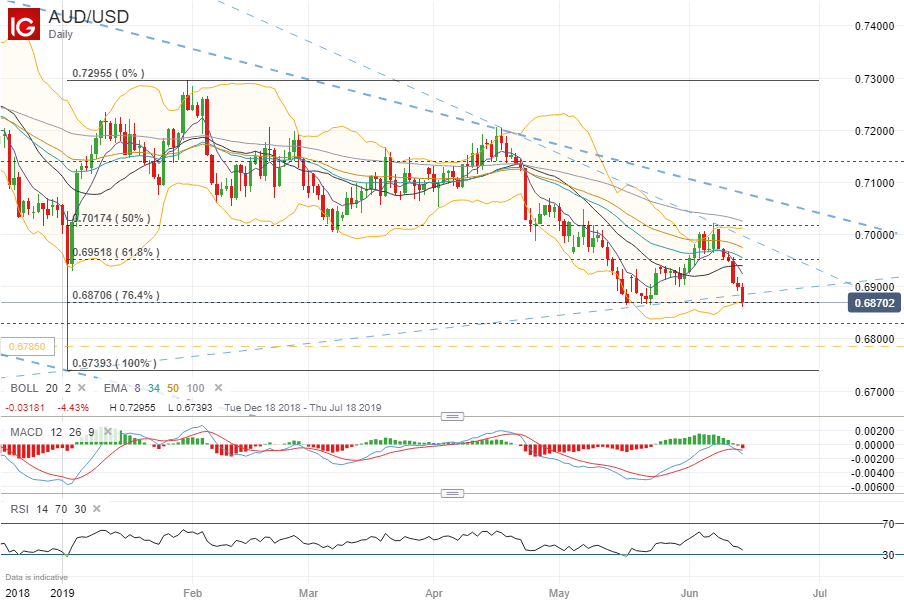
While spot AUDUSD is beginning to creep into oversold territory as suggested by the Relative Strength Index approaching a reading of 30, it could extend lower as bears continue to dominate price action. This bearish scenario would likely warrant more credence if the US Dollar gains on the back of a relatively hawkish tilt revealed by Chair Powell and the FOMC following Wednesday’s Fed meeting.
Looking to potential upside, the sharp drop in spot AUDUSD over the last week could open the door for prices to rebound due to mean-reversion as rates currently trade roughly 2 standard deviations away from its 20-day simple moving average. That being said, regaining the broken upward-slowing trendline drawn from the lows recorded in January and May is a possible first objective for AUDUSD bulls. A bounce higher might also target the 0.6900 price level where spot AUDUSD saw some buoyance at the end of May before the string of advances during the first week of June.
SPOT AUDUSD – CHART 3: 4-HOUR TIME FRAME (APRIL 23, 2019 TO JUNE 14, 2019)
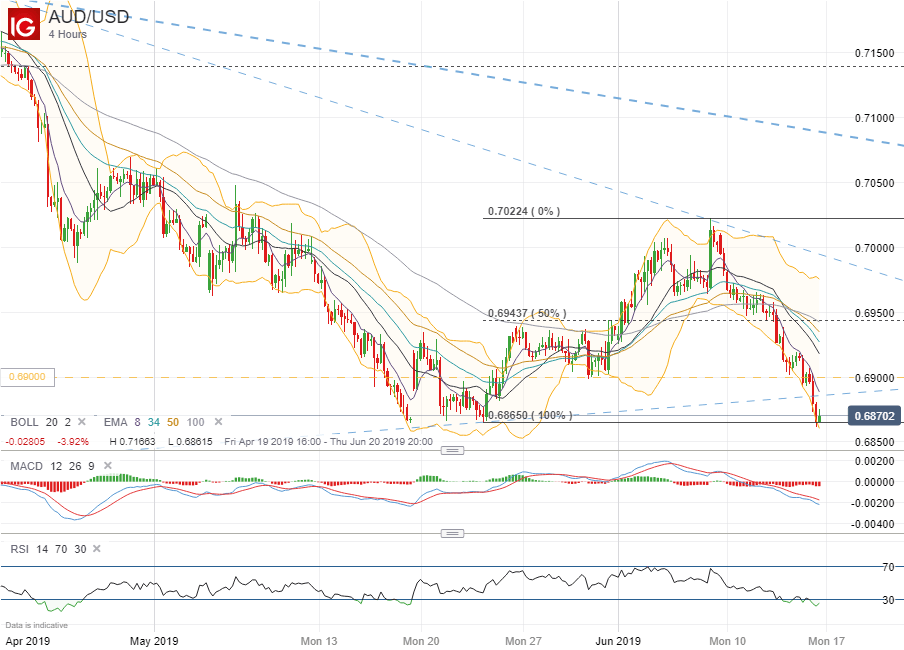
If bulls can overcome the 0.6900 rate, however, the 50.0% retracement of the most recent wave shown in chart 3 could serve as the next level of resistance. This zone around 0.6950 closely aligns with the 61.8% Fib retracement highlighted back in chart 2 and is a possible area of confluence for spot prices before targeting the 0.7000 handle again. Yet, the potential of AUDUSD bears continuing to flex their muscle next week poses a strong headwind to upside in spot prices. Further downside in AUDUSD is also suggested by IG Client Sentiment data shown below in chart 4.
SPOT AUDUSD TRADER POSITIONING – CHART 4: DAILY TIME FRAME (DECEMBER 17, 2018 TO JUNE 14, 2019)
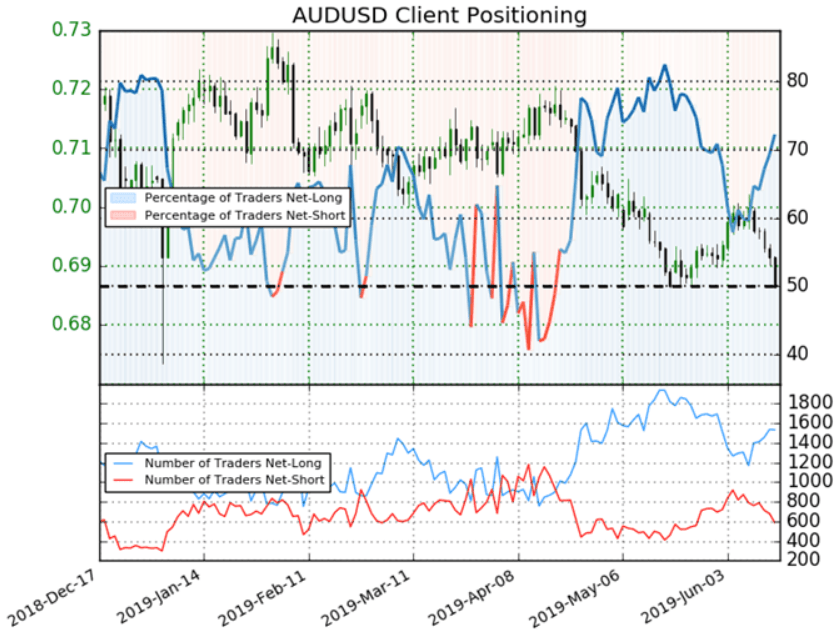
Viewing AUDUSD retail trader data with a contrarian lens, spot prices may continue to fall seeing that 72.3% of traders are net-long resulting in a long to short ratio of 2.61. Additionally, the number of traders net-long is 15.3% higher while the number of traders net-short is 32.3% lower relative to last week’s reading. For more information on analyzing client positioning data, sign up for live webinar coverage on How to Identify Trends with Trader Sentiment.
- Written by Rich Dvorak, Junior Analyst for DailyFX
- Follow @RichDvorakFX on Twitter for Timely Insight on Forex and the Global Capital Markets


