


Gold Technical Outlook
- Weekly technicals on Gold (XAU/USD) – Price holding well-defined range just above key inflection zone
- Check out our 3Q projections in our Free DailyFX Gold Trading Forecasts
- Join Michael for Live Weekly Strategy Webinars on Mondays at 12:30GMT
Gold prices decline for the second consecutive week with the precious metal off by more than 1.8% to trade at 1210 ahead of the New York close on Friday. The move carves a well-defined range in price between key inflections zones. Here are the updated targets and invalidation levels that matter on the XAU/USD weekly chart. Review this week’s Strategy Webinar for an in-depth breakdown of this setup and more.
New to Gold Trading? Get started with this Free How to Trade Gold -Beginners Guide
Gold Weekly Price Chart
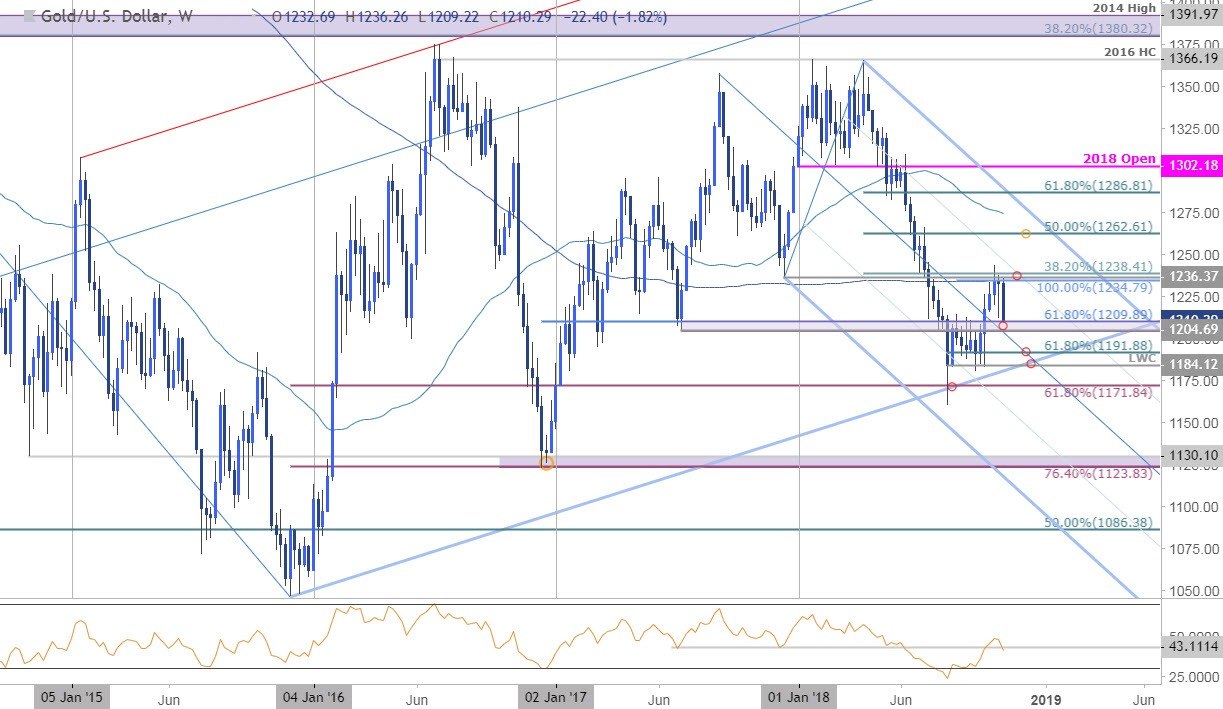
Technical Outlook: In our last Gold Weekly Technical Outlook, we continued to highlight a critical resistance confluence at 1235/38 with the immediate long-bias at risk while below. Our ‘bottom line’ cited that price had, “already set an impressive November opening-range between well-defined technical levels with the focus on a break of the 1210-1238 zone for guidance.”
A week later and price has now re-tested the upper and lower-bounds of this range and further highlights the technical significance of a break. Note that gold is poised to mark the largest single-week decline since the August lows- in fact, the last four times gold posted weekly losses of this magnitude or greater, prices saw at-least a one-week reprieve before resumption (obviously an anecdotal observation).
Put simply, IF gold prices are going to rebound, next week would be the time- and the support zone we’re trading into would be the place. A slip below the July 2017 lows at 1205 risks a retest of the lower parallel with such scenario targeting 1192 and our broader bullish invalidation level at 1184.
Why does the average trader lose? Avoid these Mistakes in your trading
Bottom line: We’ll be look for a reaction / price inflection off the 1205/10 support zone with a breach above critical resistance at 1235/38 still needed to mark resumption of the broader uptrend targeting 1262 and the upper parallel. IF price slips below this inflection zone look for steeper losses towards parallel support near the yearly low-week close at 1184. Review this week’s Gold Scalp Report for a complete technical breakdown of the intraday trading levels.
For a complete breakdown of Michael’s trading strategy, review his Foundations of Technical Analysis series on Building a Trading Strategy
Gold Trader Sentiment
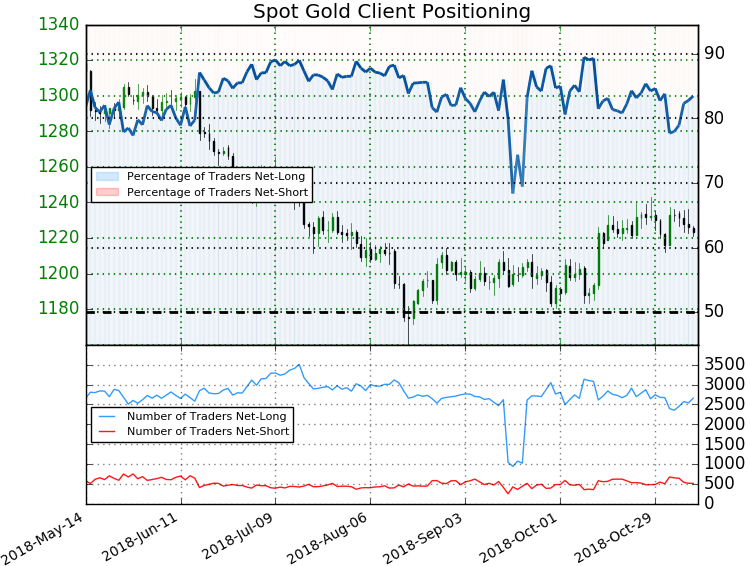
- A summary of IG Client Sentiment shows traders are net-long Gold - the ratio stands at +5.06 (83.5% of traders are long) – bearish reading
- Long positions are 6.1% higher than yesterday and 1.3% lower from last week
- Short positions are 5.2% lower than yesterday and 7.3% higher from last week
- We typically take a contrarian view to crowd sentiment, and the fact traders are net-long suggests Spot Gold prices may continue to fall. However, traders are more net-long than yesterday but less net-long from last week and the combination of current positioning and recent changes gives us a further mixed Gold trading bias from a sentiment standpoint.
See how shifts in Gold retail positioning are impacting trend- Learn more about sentiment!
---
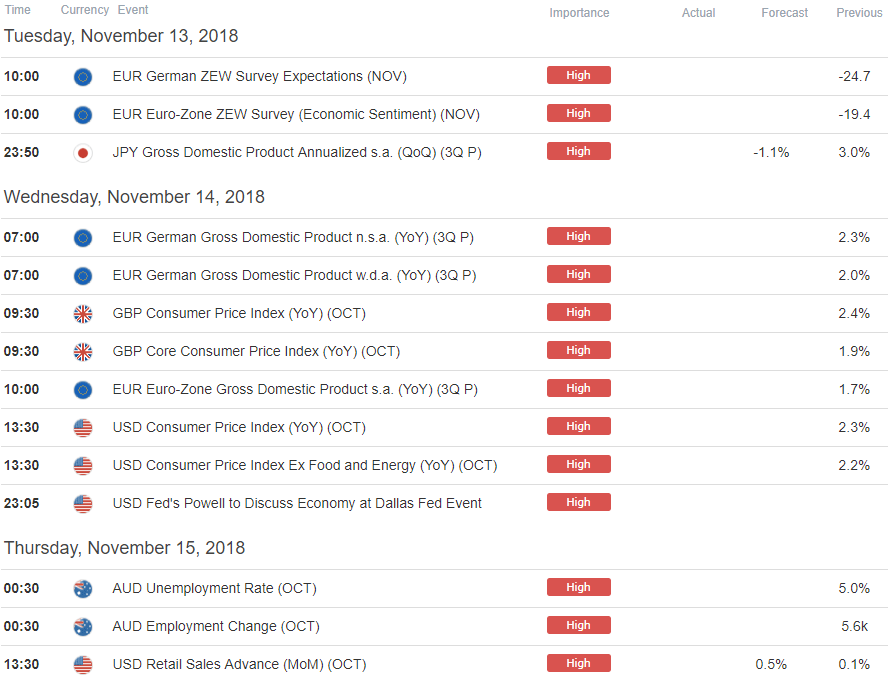
Key Economic Data Releases Next Week
- Written by Michael Boutros, Currency Strategist with DailyFX
Follow Michael on Twitter @MBForex or contact him at mboutros@dailyfx.com
Other Weekly Technical Forecast:
Australian Dollar Forecast – AUD/USD Bullish Breakout Attempt Fell Short, AUD/JPY Risks Falling
US Dollar Forecast – Dollar Attempting Another Ill-Fated Charge to Make a Bull Trend Stick


