


AUD/JPY, CAD/JPY, NZD/JPY Technical Analysis - Talking Points
- Commodity FX rejected recent lows against JPY but are yet to make new highs
- CAD/JPY nears the top of the range, still has work to do to break the downtrend
- AUD/JPY and NZD/JPY have similar set-ups. Will bigger trends emerge?
Introduction to Technical Analysis
Learn Technical Analysis
Recommended by Daniel McCarthy
AUD/JPY TECHNICAL ANALYSIS
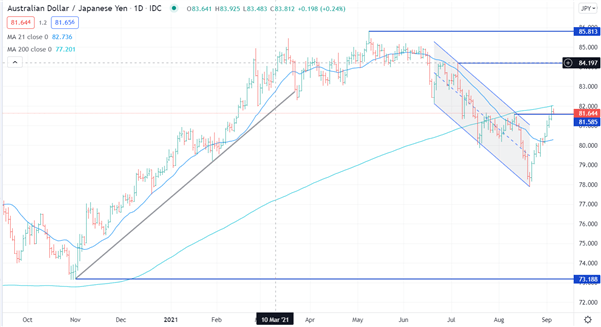
AUD/JPY has experienced a strong move higher of late after bouncing off the August low of 77.90. The move to that low was sharp and then followed by quick retracement, which suggests the market rejected the low.
With this rally, the down-sloping trend channel resistance has been broken and the previous high and resistance level at 81.58 has been overcome. The 21-day simple moving average (SMA) is pointing higher and the 200-day SMA also has a positive gradient. However, the spot price has yet to cross the 200-day SMA and its current placement at 82.02 may provide some resistance.
Further out, there is likely to be resistance at the previous high of 84.19 and then at the multi-year high of 85.81, seen in May.
AUD/JPY DAILY CHART
CAD/JPY TECHNICAL ANALYSIS
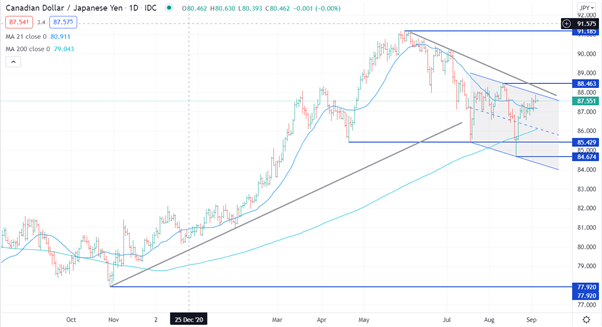
CAD/JPY is in a bearish-sloping trend channel at the moment, after breaking the up-trend line support. The trend line from the November bottom of 77.92 held until July when the current trading channel began.
The July selloff tested the previous low at 85.43 but the level held on that first attempt. The second move to test the 85.43 support smashed through to print a low of 84.67. This move quickly retraced back up through the 200-day SMA and is testing the top side of the channel.
A break-out above this barrier would be met with more resistance levels. 88.25 is a down trend channel line and 88.46 is the previous high. Beyond that, there is a minor resistance level at 90.40 before the more significant resistance at the multi-year high of 91.18
CAD/JPY DAILY CHART
NZD/JPY TECHNICAL ANALYSIS
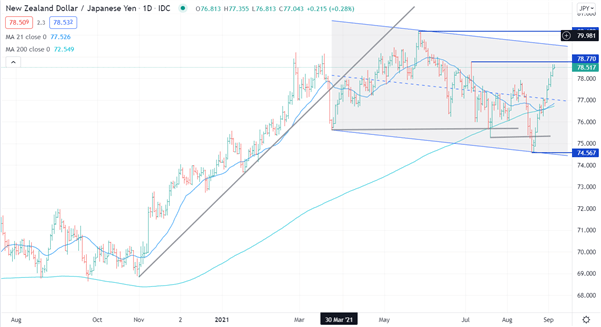
NZD/JPY has been in a wide sideways trading pattern since February, with a slight bias in the trading channel pointing down. It’s possible this may be a pause in a bigger-picture move.
In mid-July and then again in mid-August, the cross made a new low, but in both cases, the sell-off was short lived and rejected.
The current formation came after a fast-moving rally from 68.80 in November to 79.20 in March. The short-term 21-day simple moving average (SMA) did not break below the longer-term 200-day SMA suggesting that the was not enough momentum to push significantly lower.
On the topside the 2 previous highs of 78.77 and 80.18 are the next resistance levels.
NZD/JPY DAILY CHART
--- Written by Daniel McCarthy, Strategist for DailyFX.com
To contact Daniel, use the comments section below or @DanMcCathyFX on Twitter
Trade Smarter - Sign up for the DailyFX Newsletter
Receive timely and compelling market commentary from the DailyFX team


