


To receive Tyler’s analysis directly via email, please SIGN UP HERE
Talking Points:
- Crude Oil Technical Strategy: Pulling Away From Long-Term Support
- Momentum Shows Oil May Still Have Room to Run Higher
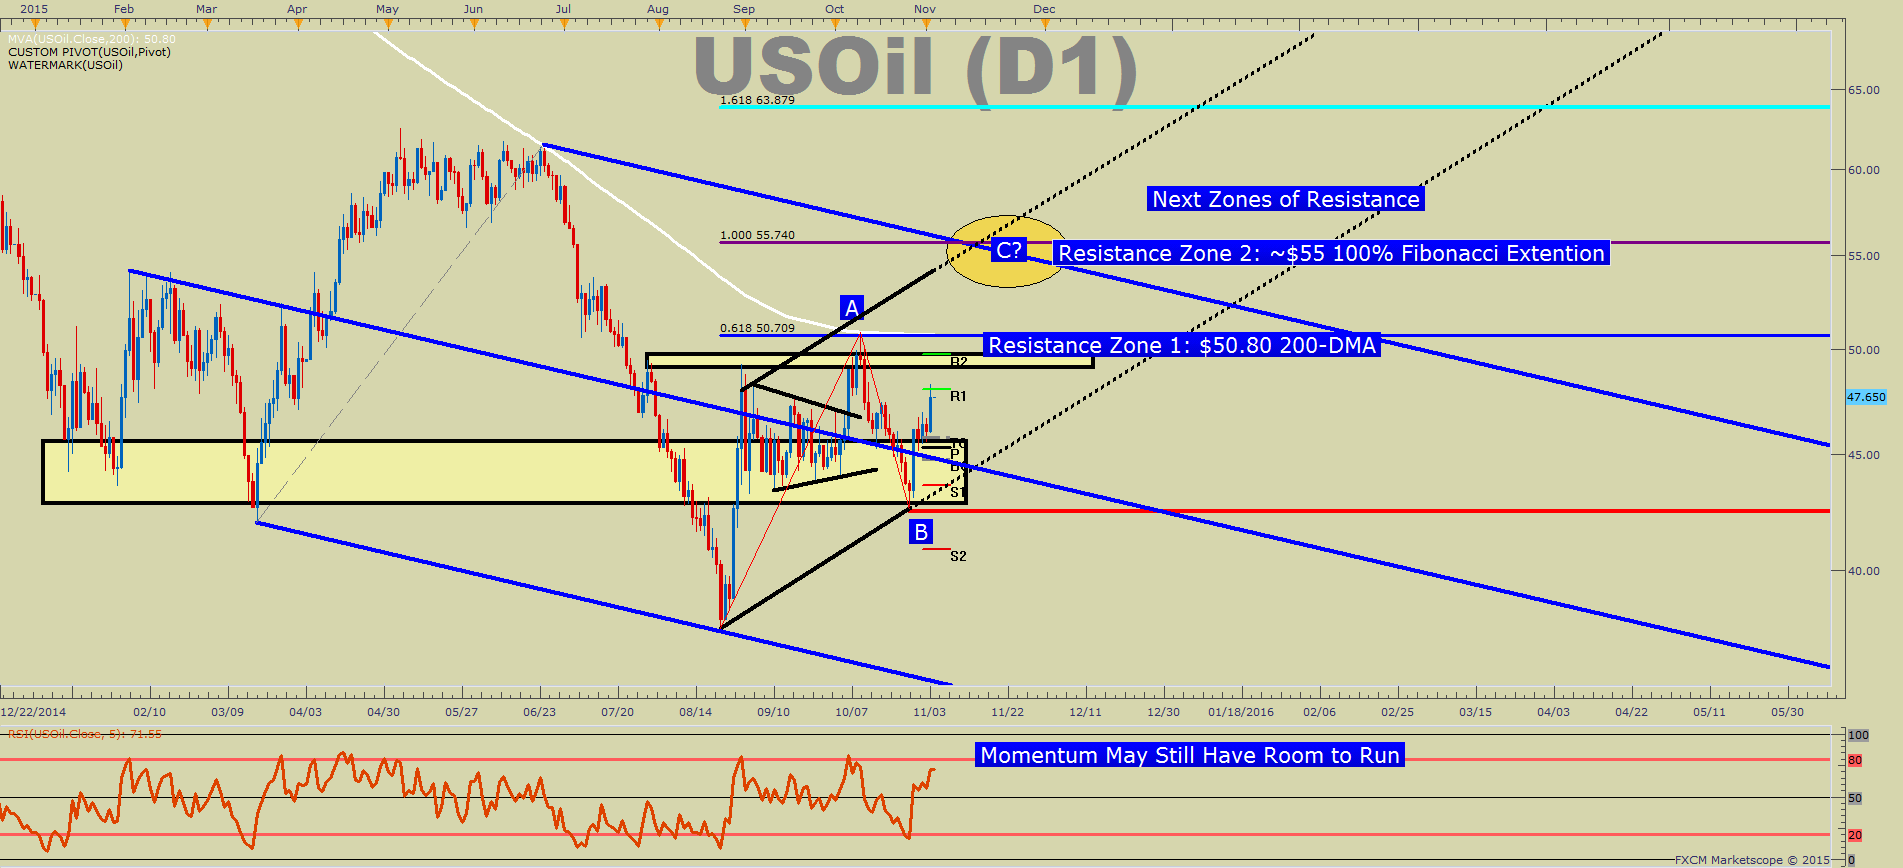
- Next Big Test Remains at 200-DMA For Long-Term Directional Bias
WTI Crude Oil price punched higher toward three-week highs today. There was speculation by U.S. refineries that crude demand was increasing alongside a trend of lower production caused a clean bid in Crude. The rise was in stark contrast to other commodities, namely metals that ended the day in the red by 1% or greater. However, the 3.8% move higher in crude is aligning with a stabilization in economic data, which is beginning to chip away at the fear of supply remaining on the market due to falling economic data.
The Daily crude oil price chart is bouncing aggressively off the $43 per barrel support zone (yellow box on chart). Many technicians would point to the break below the yellow boxed support zone as an invalidation of the uptrend and the argument that we’re heading higher. Of course, it’s easy to point to the SPX500 that has risen near new highs after the aggressive sell-off on August 24th. If Oil goes the way of equities and we continue to hold above the $43 per barrel price, the case for a retest of the 200-day moving average near $51 per barrel becomes increasingly strong followed by the 100% Fibonacci extension near the top of the blue price channel near $55 per barrel. Additionally, the relative strength Index on the bottom of the chart shows there is likely still room to run higher
Going back to the beginning of the year, Oil has pivoted and turned higher towards the end of a calendar month. Late January, March, & August all saw late month moves that eventually gave way to multiple percentage moves higher. October 26th saw a similar late month pivot that resulted in a ~10% rally that may have a lot of gas in the tank. Still, the clearest sign that a recognized breakout in US Oil is coming would be a weekly close above the 200-day moving average and a breakdown in the inversely correlated US Dollar.
We hope you enjoyed this short-term Oil Outlook, be sure to sign up for our free oil guide here.
(Click chart for larger image)
--- Written by Tyler Yell,CMT,Currency Analyst and Instructor
Contact and follow Tyler on Twitter: @ForexYell


