


- DAX 40:Falls as slowdown in economic activity weighs on eurozone.
- FTSE 100:Slumps as UK services sector struggles, strike action looms.
- DOW JONES: Trades lower as recession jitters return.

DAX 40: Falls as Slowdown in Economic Activity Weighs on Eurozone
The Dax fell in European trade as any early optimism fades, with losses of 2.8% in the session.
The news in Europe this morning failed to inspire as PMI numbers were released. Although some members met expectations the vast majority show signs of a slowdown in overall economic activity.
German gas giant Uniper SE is in talks with the government over a potential bailout package of as much as 9 billion euros, ($9.4 billion). The government is looking at applying a set of measures, including loans, taking an equity stake and also passing part of the surge in costs onto customers, said two people familiar with the talks.Chancellor Olaf Scholz has activated the second phase of the country's three-stage emergency gas plan, with the threat of rationing if the situation worsens.
The sectoral breakdown is not for the faint of heart with financials and industrials leading the way on this bloody Tuesday.
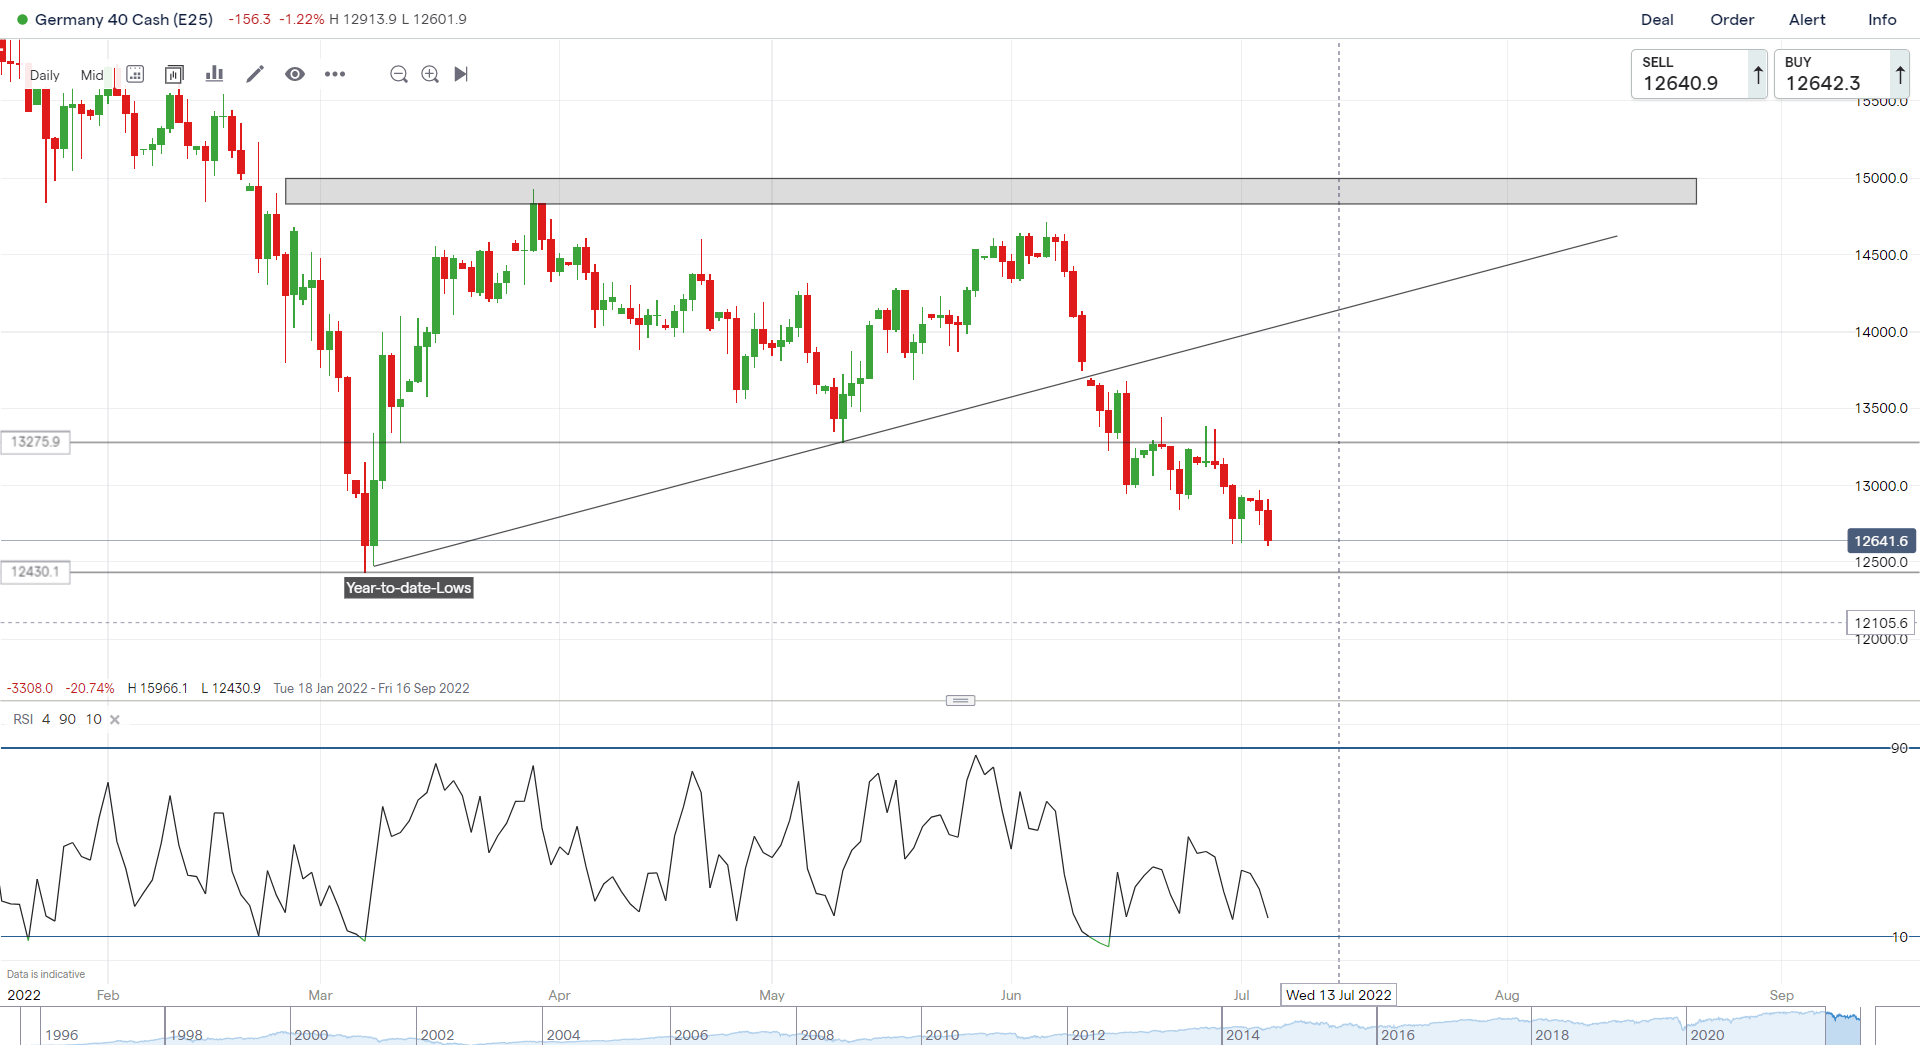
DAX 40 Daily Chart- July5,2022
Source: IG
From a technical perspective, last week finally saw a weekly candle close below the key psychological 13000 level.
The daily candle yesterday retested the psychological level before declining. Early European trade saw this downward pressure persist as we continued to edge toward the year-to-date lows. With these lows now met we might see a bounce from this level before a retest and potentially a break and close below.
Key intraday levels that are worth watching:
Support Areas
- 12430
- 12031
- 11550
Resistance Areas
- 12945
- 13290
- 13650
Introduction to Technical Analysis
Time Frame Analysis
Recommended by Zain Vawda
FTSE 100: Slumps as UK Services Sector Struggles, Strike Action Looms
The FTSE opened marginally higher in European trade before souring global sentiment dragged it down. The blue-chip index is down around 2.2% as we approach the US market open.
For the month of June, the UK services sector suffered the worst growth in new orders since February 2021 as the S&P Global Services PMI index registered 54.3, up slightly from 53.4 in May. However, the average reading in the second quarter was well below that seen in the first three months of the year.
UK car sales suffered recording their worst June sales since 1996, while first half sales fell 12% to 800,000 units. The dire showing reflects ongoing supply chain troubles that have led to severe shortages of key parts.
Meanwhile, UK train drivers are set to vote on their first national strike since 1995 in a move that threatens to intensify travel chaos over the summer.It follows reports in The Telegraph that the unions will coordinate strike action over the summer in a move that could leave just one in 10 trains running and cause disruption for days on end. Meanwhile, British Airways is set to cancel flights for 100,000 passengers in July, with popular routes to Malaga, Ibiza and Faro affected.
The sectoral breakdown is not pretty with losses dominating, while energy and basic material lead the way with declines of 4.05% and 3.04% respectively.
Introduction to Technical Analysis
Support and Resistance
Recommended by Zain Vawda
FTSE 100 Daily Charts - July5,2022
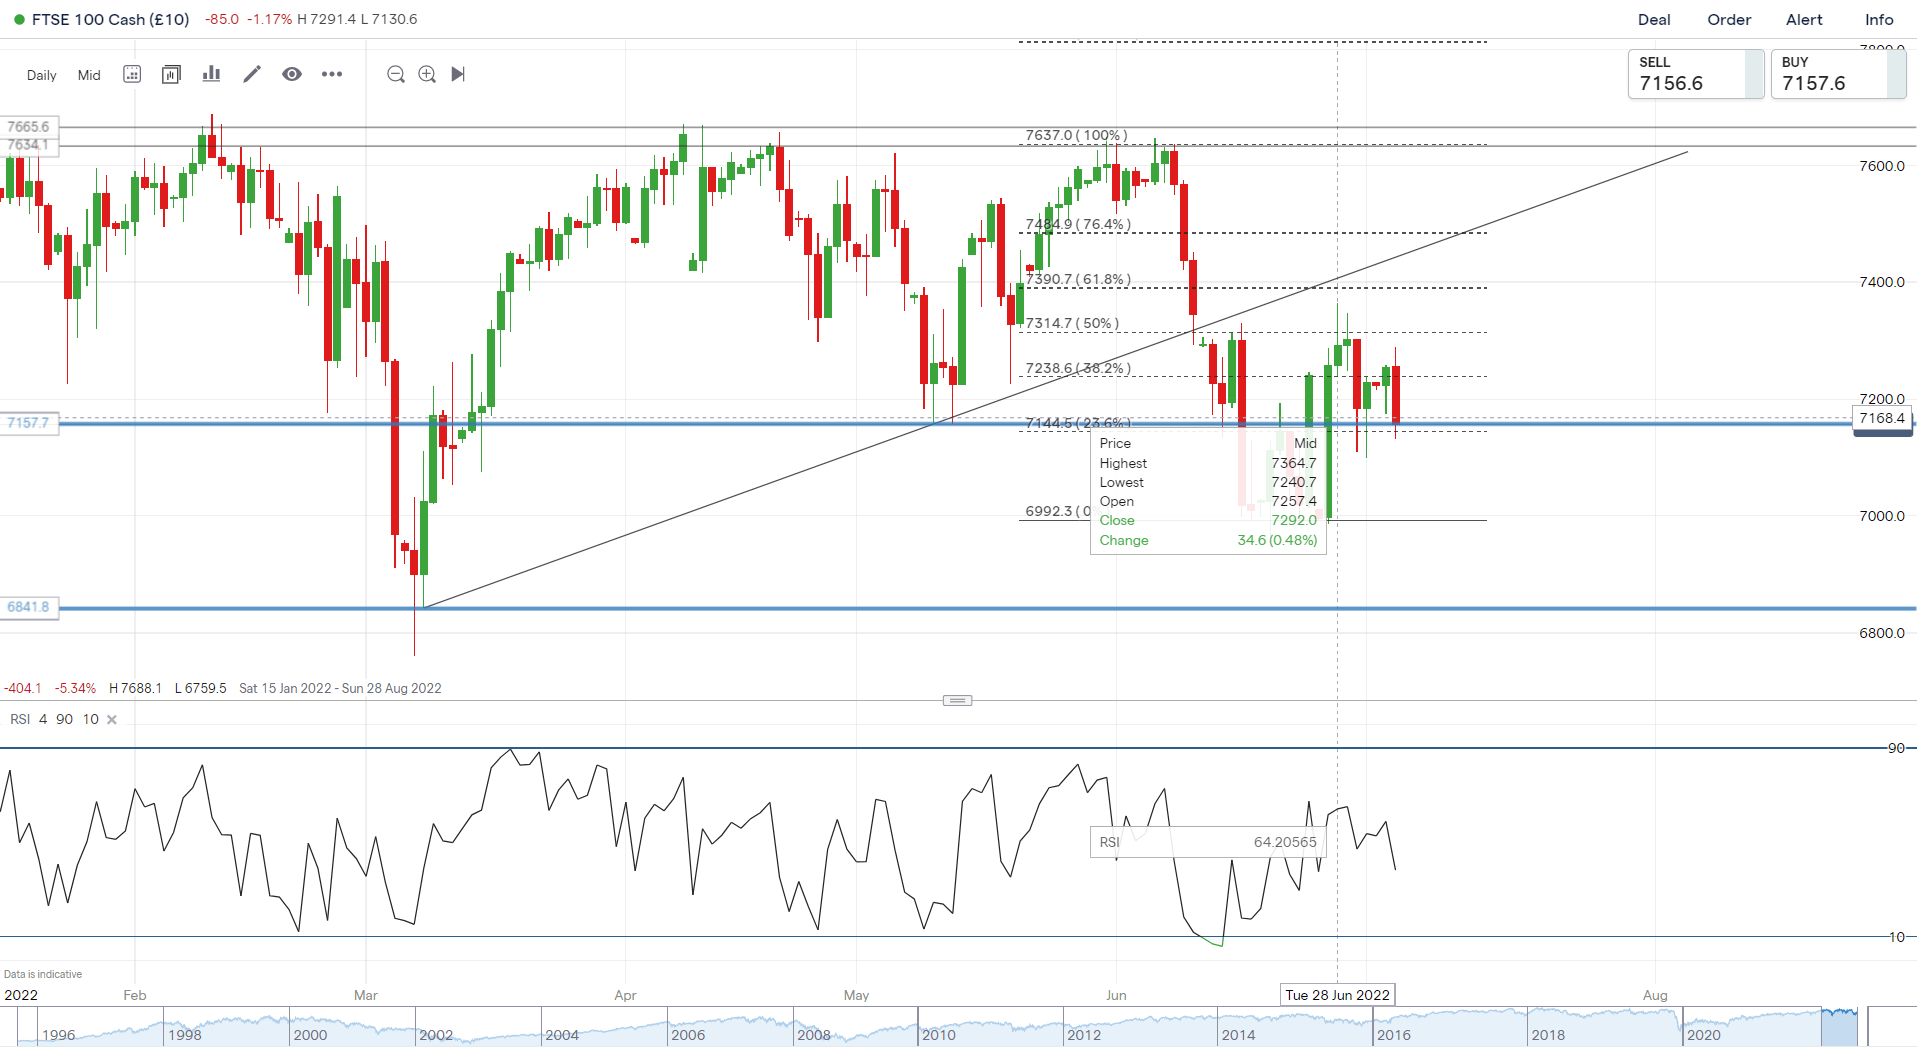
Source:IG
The FTSE bounced off the support area 7080 on Friday, with the weekly candle closing as a Doji candlestick signaling indecision.
Yesterday’s daily candle closed just above the 38.2% fib level before today decline retesting the 23.6% fib level. We seem to be rangebound on the FTSE much like the DAX with upside capped by the 50% fib level and downside the 23.6% fib level. Should this persist rangebound opportunities may be the most appealing for traders.
Trading Ranges with Fibonacci Retracements
Key intraday levels that are worth watching:
Support Areas
- 7080
- 6990
- 6870
Resistance Areas
- 7197
- 7284
- 7400
| Change in | Longs | Shorts | OI |
| Daily | 9% | -5% | -3% |
| Weekly | 18% | -3% | 0% |
DOW JONES: Lower as Recession Jitters Return
The Dow openedlower in premarket following yesterday’s US holiday as recession jitters returned.
US markets reopen Tuesday after capping 11 declines in the past 13 weeks as a first-quarter contraction in the world’s largest economy boosted the prospects of a recession.Short-end rates led a selloff in treasuries on Tuesday, with the two-year yield jumping to 2.93%.
However, the news of US-China talks perked up sentiment in the equity markets in Asia and early European trade before any optimism faded.
Light day on the calendar front with US factory orders (MoM) for the Month of May due at 14h00GMT.
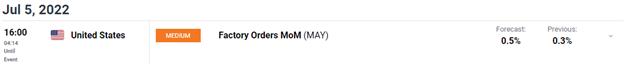
Customize and filter live economic data via our DailyFX economic calendar
DOW JONES Daily Chart – July 5,2022
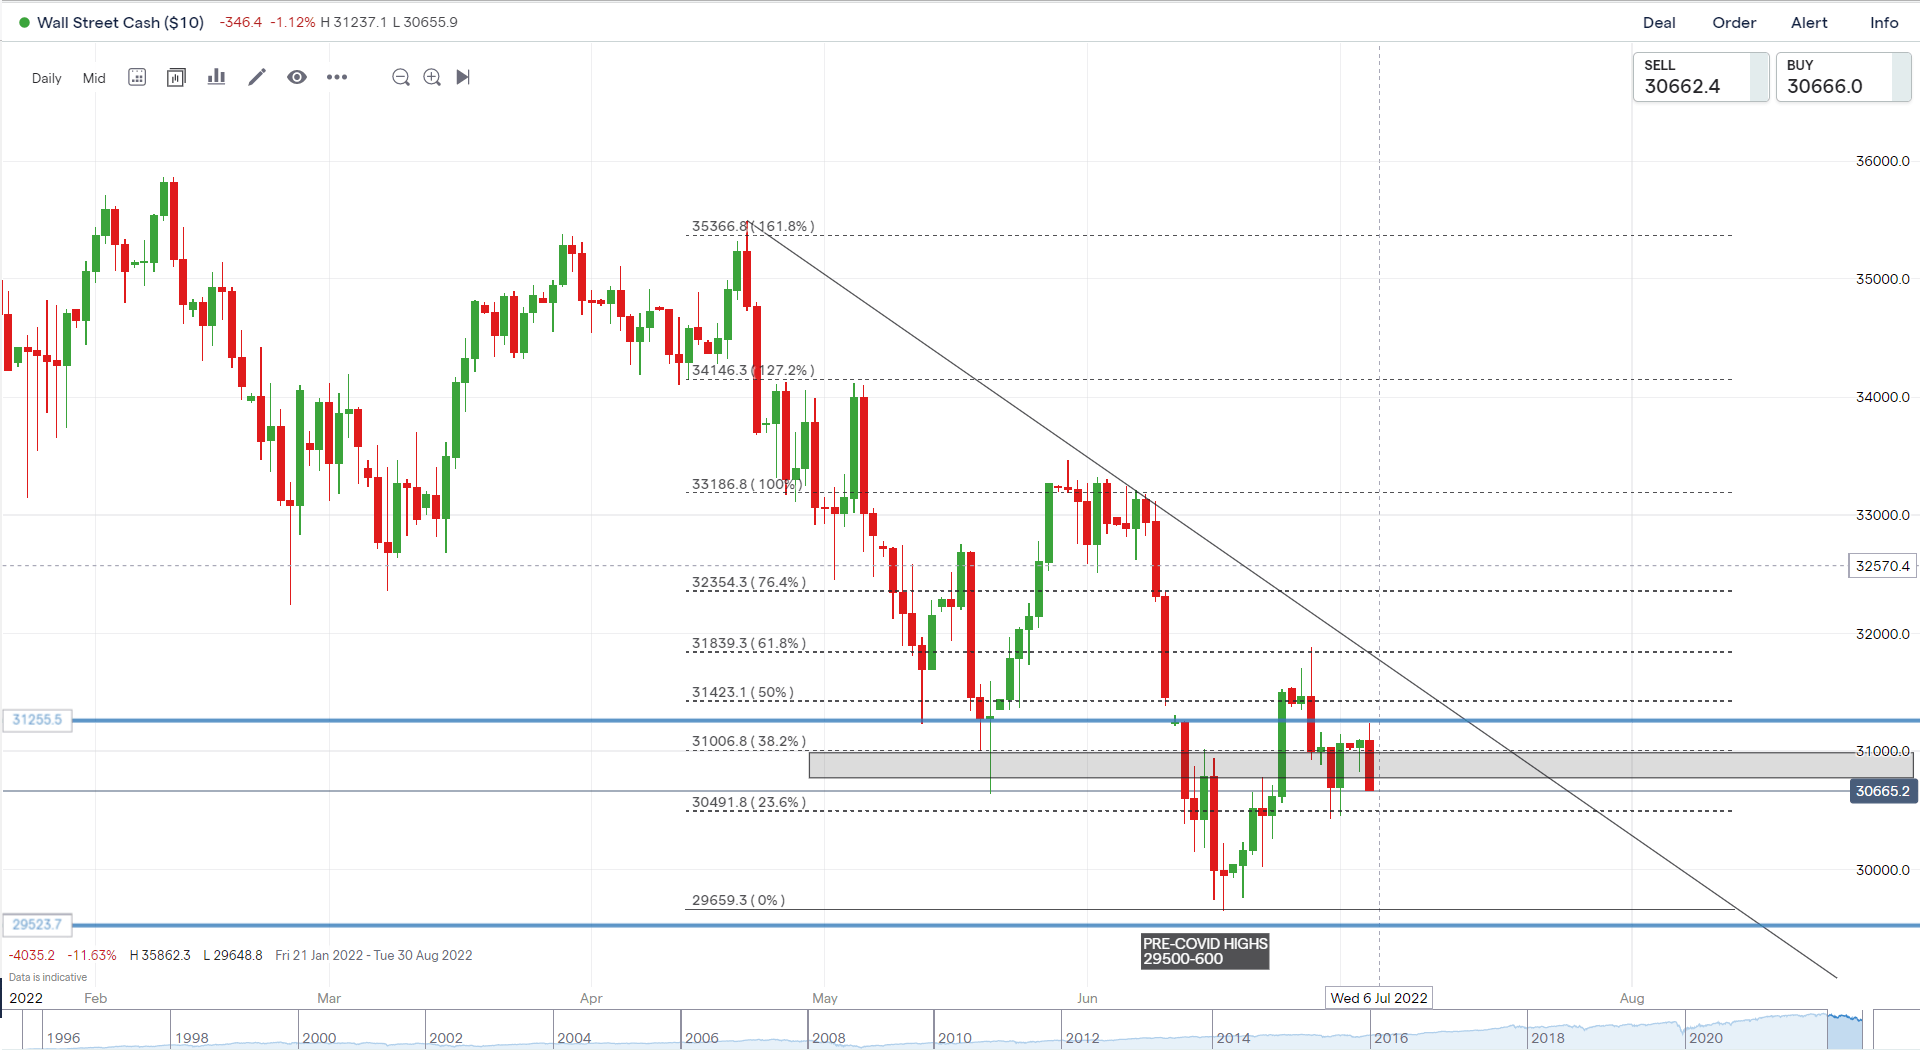
Source: IG
From a technical perspective, we pushed above our key psychological area 31000 (grey box on the chart) and had a daily candle close yesterday. However, the upside was capped by our resistance area 31255 before declining sharply in European trade.
Price remains pressured, and we currently trade back below the 31000 level as we approach our 23.6% fib level. A break below could see us finally test the pre-covid highs around the 29500 area.
Key intraday levels that are worth watching:
Support Areas
- 30500
- 30000
- 29500
Resistance Areas
- 31000
- 31420
- 32000
| Change in | Longs | Shorts | OI |
| Daily | -15% | 5% | -4% |
| Weekly | 12% | -1% | 4% |
Written by: Zain Vawda, Market Writer for DailyFX.com
Contact and follow Zain on Twitter: @zvawda


