


DAX 40:Moves Higher as ECB President Christine Lagarde Vows Nimble ECB Policy.
- FTSE 100:Rallies Higher as Commodity Linked Stocks Thrive.
- DOW JONES: Gains as Inflation Risks Fail to Sour Sentiment.
Foundational Trading Knowledge
Understanding the Stock Market
Recommended by Zain Vawda
DAX 40: Moves Higher as ECB President Christine Lagarde Vows Nimble ECB Policy
The Dax opened in the green in European trade on the back of news that China will ease its covid restrictions. The latest GfK German consumer climate index fell to -27.4 in July from a revised -26.2 the previous month, as shoppers in the Eurozone’s largest economy struggled with hefty price rises.
Investors will be keeping an eye on a meeting of European Central Bank (ECB) officials in Sintra, Portugal. ECB President Christine Lagarde opened proceedings today and offered reassurances stating that any new anti-crisis instrument yet to be announced won’t stand in the way of rate hikes to combat inflation.
Meanwhile, European Central Bank (ECB) member Martins Kazaks reiterated his belief that rates could be raised “quite quickly” should the need arise. He told Bloomberg TV that if the ECB hiked 25 bp in July then a 50 bp move in September would be needed.
The sectoral breakdown is broadly positive with healthcare and industrials leading the way while Utilities and real estate lag. Among the notable movers of the session, we have Porsche Automobil Holdings SE, Airbus SE and Siemens Healthineers leading the way with 3.5%, 2.2% and 1.8% respectively.
DAX 40 Daily Chart- June 28, 2022
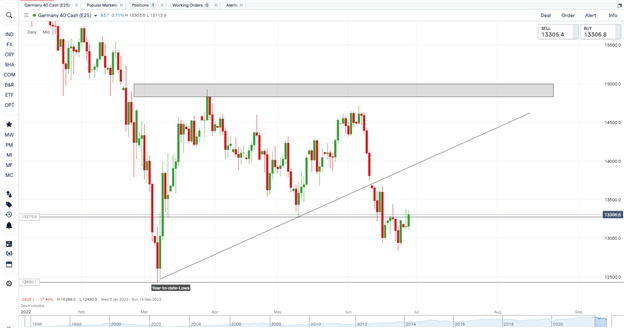
Source: IG
From a technical perspective, we have bounced since creating a new monthly low (12833) last week. Yesterday looked promising as it seemed as though we may have a daily candle close above key resistance area at 13275 (See chart). Once again, we rejected this level with a daily candle close below showing us any upside rally may be short lived.
Unless we have a daily candle close above resistance, we will continue to be range bound between resistance and the psychological 13000 level.
Key intraday levels that are worth watching:
Support Areas
- 13230
- 13080
- 12975
Resistance Areas
- 13334
- 13480
- 13585

FTSE 100: Rallies Higher as Commodity Linked Stocks Thrive
The FTSE continued its strong start to the week in the European session on the back of further gains for mining and oil companies.China easing covid restrictions has provided a boost for commodity linked stocks.
Attention instead remains on the UK economic backdrop, which saw inflation hit a 40-year record of 9.1% last month, with analysts of the belief that UK inflation is yet to peak.
British Prime Minister Boris Johnson pressed on with plans to pass legislation through parliament this year to scrap some of the rules on post-Brexit trade with Northern Ireland.
The sectoral breakdown is predominantly green as basic materials and energy lead the way. Notable movers for the session include Rolls-Royce Holdings PLC, Shell PLC, BP PLC and Glencore with gains of 6.6%, 3.8%, 3.1% and 3.2% respectively.
Introduction to Technical Analysis
Technical Analysis Chart Patterns
Recommended by Zain Vawda
FTSE 100 Daily Charts - June 28, 2022
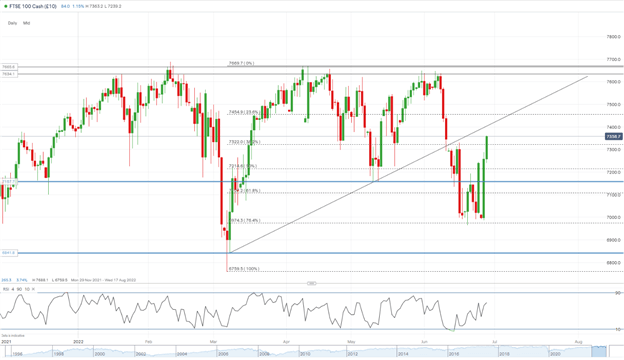
Source:IG
The FTSE continues its bullish move since breaking above the resistance area 7157. Since the double bottom around the psychological 7000 level formed we have pushed higher gaining around 350 points.
As we approach the ascending trendline we may find resistance around the 7400-7500 area, which lines up perfectly with the 61.8% and 76.4% Fib levels adding an extra confluence.
Key intraday levels that are worth watching:
Support Areas
- 7250
- 7216
- 7140
Resistance Areas
- 7368
- 7454
- 7568
| Change in | Longs | Shorts | OI |
| Daily | -2% | 0% | 0% |
| Weekly | -23% | 5% | -1% |
DOW JONES: Gains as Inflation Risks Fail to Sour Sentiment.
The Dow continued its march higher in premarket trade as concerns around global growth were eased by China’s softening covid protocol. Meanwhile, analysts have raised concerns regarding bullish earnings estimates being a risk with the US economy set to slow next year.
Michael Burry of the ‘Big Short’ fame suggested on Twitter that the “Bullwhip Effect” happening in the retail sector may lead to the Federal Reserve reversing rate increases and its quantitative tightening policy. The “Bullwhip Effect” is the deflationary effects of retailers holding too much inventory. The theory is that they will eventually have to drop prices to relieve themselves of the goods they have stockpiled.
How to Use Twitter for Traders
Later in the day we have US Consumer Confidence numbers followed by a speech from US Federal Reserve Member Mary C. Daly.
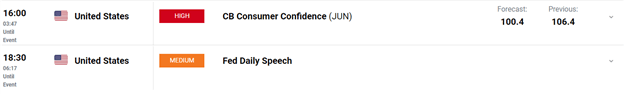
Customize and filter live economic data via our DailyFX economic calendar
DOW JONES Daily Chart- June 28, 2022
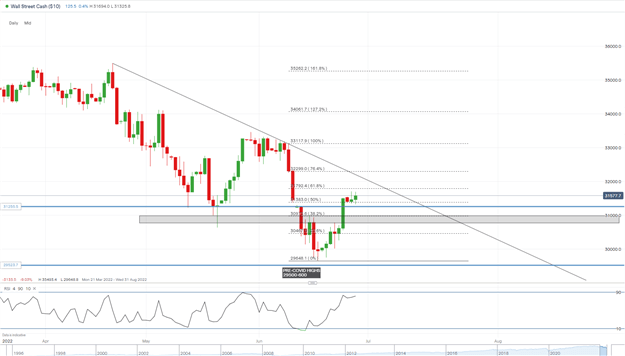
Source: IG
From a technical perspective, yesterday we closed with an inverted hammer on the daily timeframe staying above the support area 31300 which lines up with the 50% Fib Level.
Should price remain above the support area we could push higher and retest the trendline at the 31950 area. This area rests perfectly within the 61.8% and 76.4% Fib levels, which could provide strong resistance. Any rejection here could see price pullback toward our support area.
Key intraday levels that are worth watching:
Support Areas
- 31300
- 31000
- 30670
Resistance Areas
- 31670
- 31950
- 32300
| Change in | Longs | Shorts | OI |
| Daily | 37% | -11% | 7% |
| Weekly | 41% | -15% | 5% |
Written by: Zain Vawda, Market Writer for DailyFX.com
Contact and follow Zain on Twitter: @zvawda


