Rand Dollar Price Action:
- USD/ZAR rests on Fibonacci support
- Price action remains within confluent zones
- Moving Average provides additional support
USD/ZAR price action edged higher today, buoyed by a decrease in demand for Emerging Market currencies along with US Dollar strength. Despite the approval of an additional $1.9 Trillion US Fiscal Stimulus Package, the USD remained resilient as an increase in global Covid-19 related cases combined with rising US Treasury yields bolstered the demand for the safe-haven currency.
Given the current economic conditions, the Rand remained resilient despite South Africa recording its greatest number of deaths since the start of the Coronavirus pandemic. Despite the reimplementation of more stringent measures, the rapid spread of the second wave continues to place immense pressure on the economy as a whole.

USD/ZAR Technical Analysis
After retreating from April highs, the formation of a Death Cross provided relief for the bears as the Rand strengthened against its US major counterpart. However, after eight consecutive weeks of gains, USD/ZAR price action came to a halt after falling to a key level of support, formed by the 61.8% retracement level of the 2018 – 2020 move, around 14.500. Now, as the battle between bulls and bears persists, price action continues to trade in a confluent zone, formed by the Fibonacci retracement levels which continue to provide support and resistance for the pair.

USD/ZAR Weekly Chart

Chart prepared by Tammy Da Costa, IG
Currently, the downward trend pertaining to USD/ZAR continues to hold, with the 78.6% Fibonacci retracement level of the 2020 move providing support at a level of 15.105. A break below support may result in a retest of 14.500, provided that bears are able to break below the key psychological level of 15.00. The Relative Strength Index (RSI) remains within range, with a current reading of 53, while prices have risen above the 50-Day Moving Average (MA) on the daily chart.
USD/ZAR Daily Chart
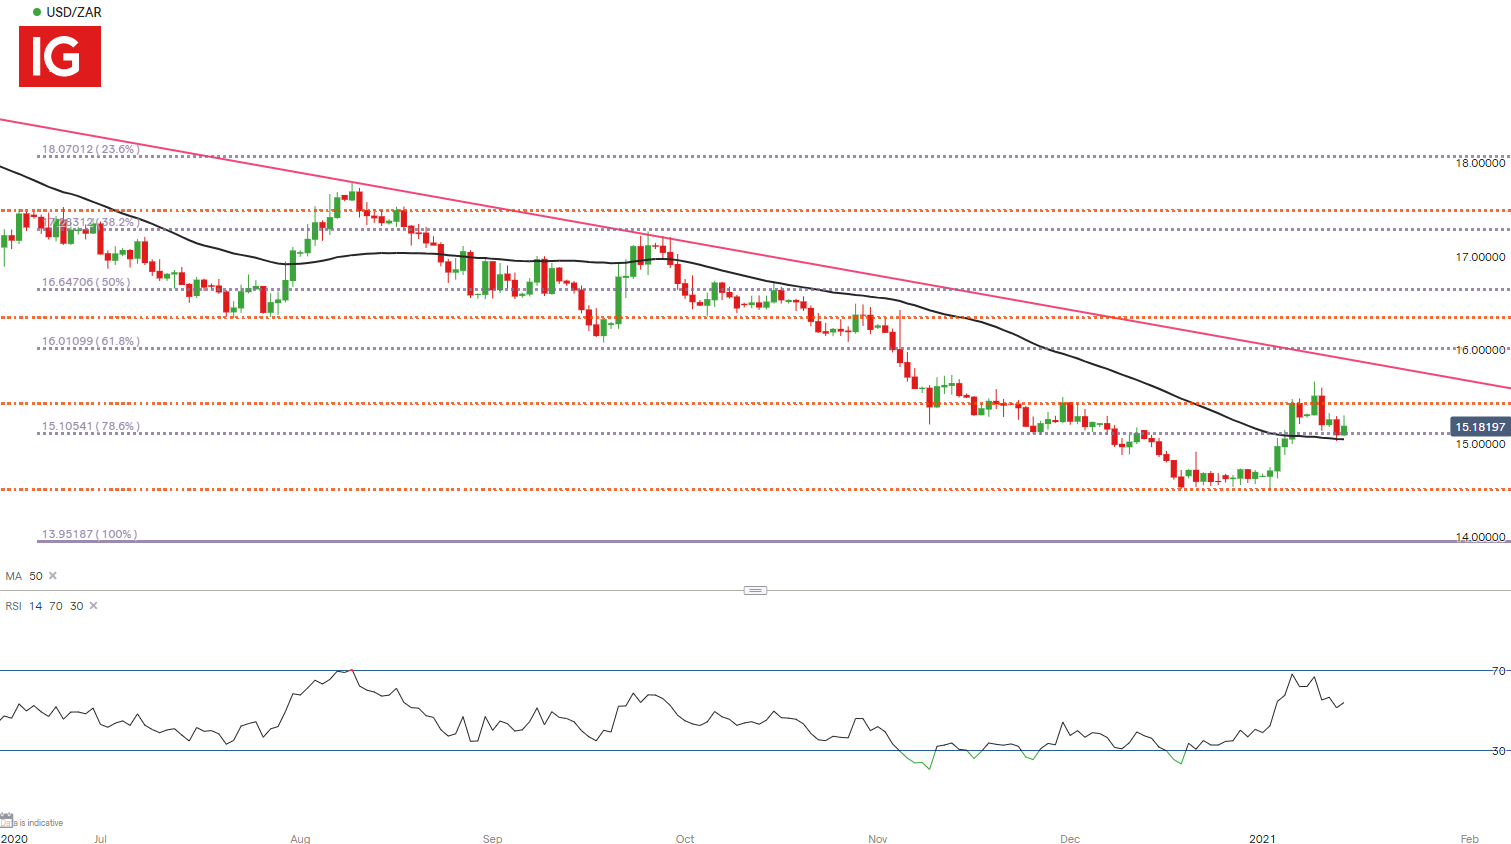
Chart prepared by Tammy Da Costa, IG
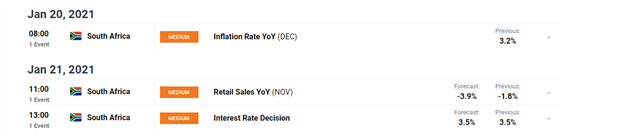
Week Ahead
With the reimplementation of new lockdown restrictions, this week’s inflationary data and Interest rate decision will likely be an additional driver of price action. Although consensus remains in favor of rates remaining unchanged, any surprise cuts by the South African Reserve Bank (SARB) will likely result in an increase in volatility and further whipsaw price action.
DailyFX Economic Calendar
--- Written by Tammy DaCosta, Market Writer for DailyFX.com
Contact and follow Tammy on Twitter: @Tams707