
Key Talking Points:
EUR/USD
EUR/USD is trading a little softer this morning as the pair reacts to the approval of a stimulus package in the US and the ongoing talks regarding Brexit. In what was a general risk-off day yesterday, EUR/USD retreated to last week’s low but found support at the da-day moving average at 1.2130.

The discovery of a new strain of the virus added to the worsening of the health condition in many countries, which put downside pressure on risk-on assets that were already venturing far into overbought territory. This I turn led to an increase in demand in the US Dollar as a safe-haven, which rose to just under 91.00, its highest value in 10 days.
Given the proximity of the Christmas holiday, I’m expecting to see consolidation at current prices for the next few days in the absence of a risk event, but a reduction in liquidity in the days between Christmas and New Year could see volatility increase rapidly.
EUR/USD Daily chart
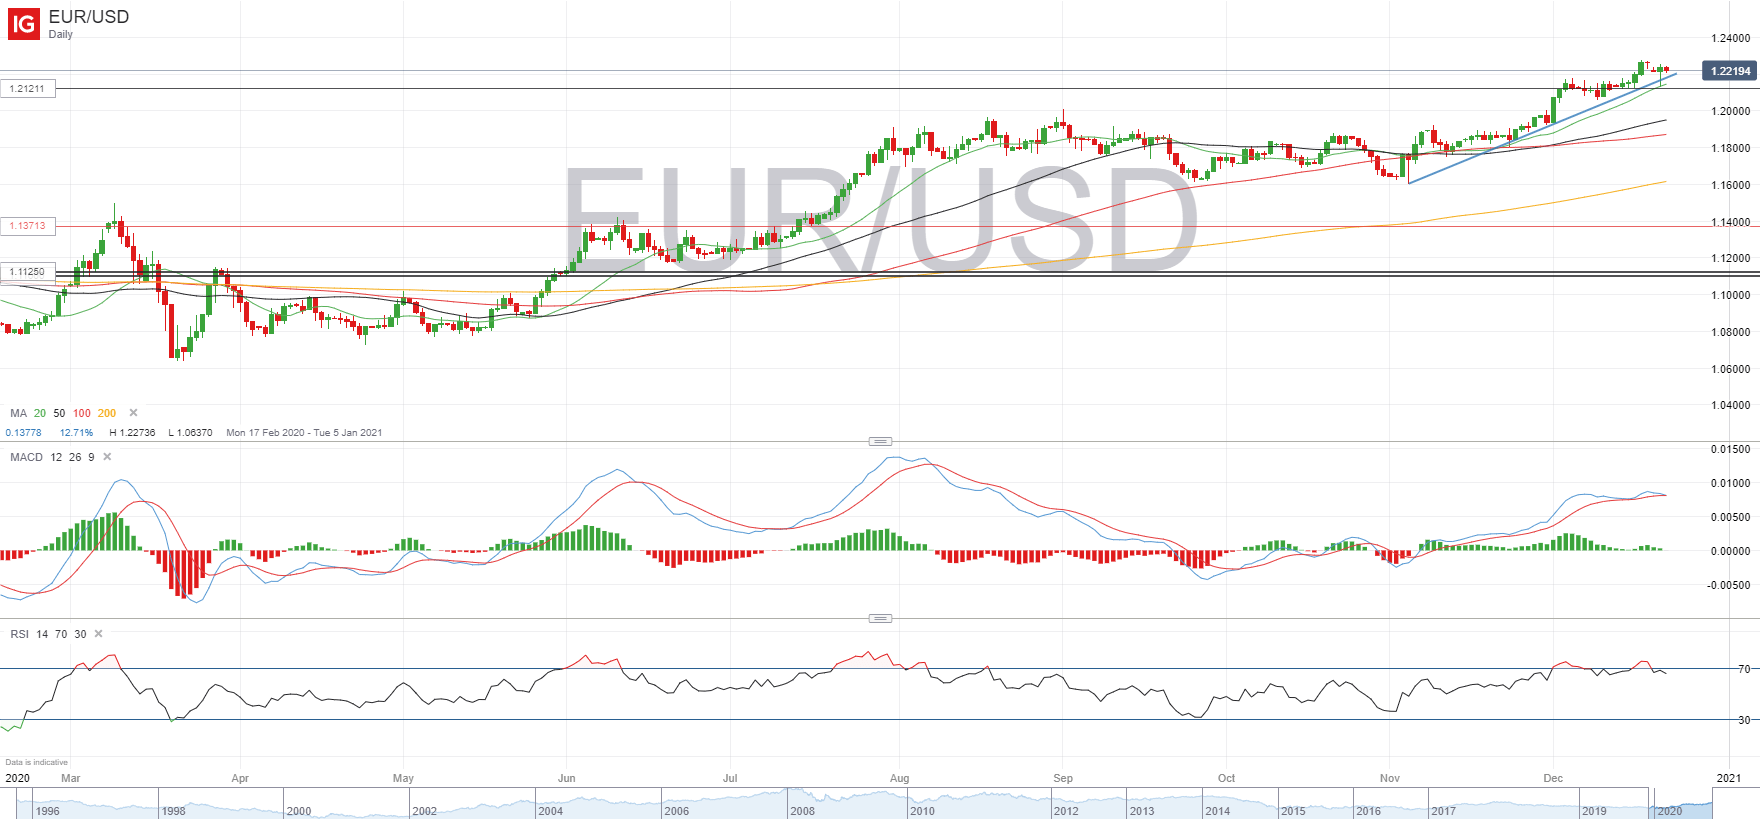
Looking at the daily chart, the rising support trendline formed by connecting the lows since November 4th continues to be an important area going forward. If downside pressure sees another fall below this line, 1.2120 comes in as the next area of support, with a fall below 1.20 seen as the objective for sellers. On the upside, we need to see a break above 1.2270 to start considering a possible push towards 1.24.
| Change in | Longs | Shorts | OI |
| Daily | -19% | 24% | 0% |
| Weekly | -4% | 4% | 0% |
EUR/GBP
The UK and EU have sent 54 months trying to decide how to define their relationship past December 1st 2021, and whilst the pound was taking advantage of what seemed to be a possible light at the end of the tunnel, it only took 24 hours for the coronavirus to steal the spotlight and send the pound crashing on Monday after the UK was left virtually isolated from the rest of Europe to avoid the spread of this new strain.
EUR/GBP has been highly volatile since the beginning of the month, as news headlines about Brexit took over market sentiment. Prior to December, the pair had been in a clear downward trajectory which was expected to culminate in a break of key support at 0.8863, but the fear the UK would leave the EU without a deal took over, meaning the pound was left weakening against an already strong euro.
EUR/GBP Daily Chart
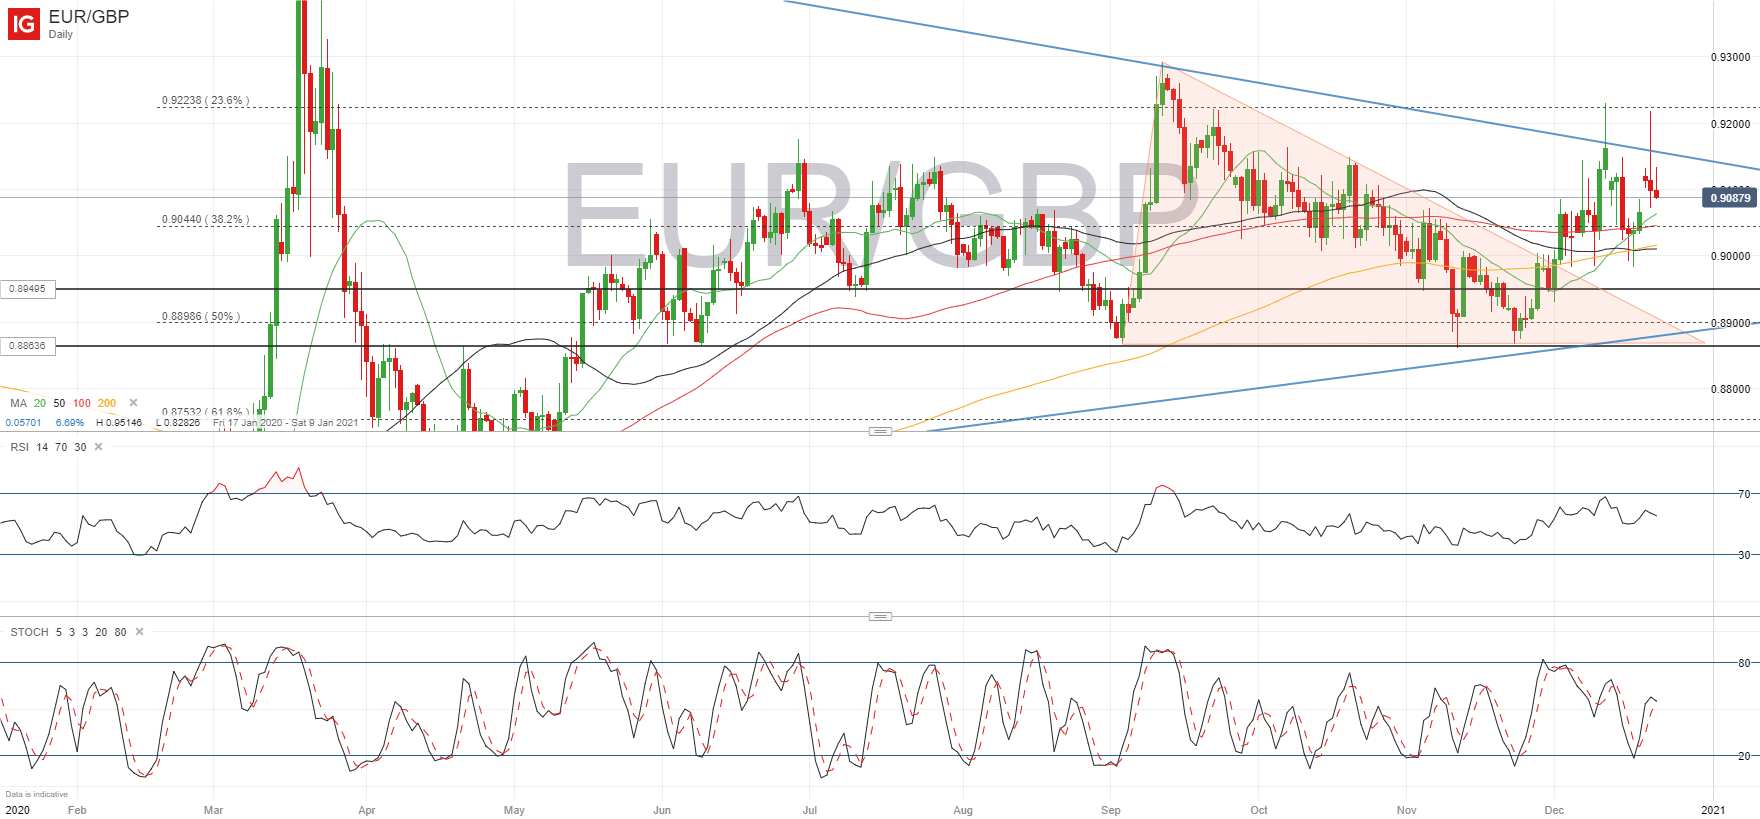
We are now about halfway of the range that has been in play for the most part of the last 6 months, from 0.8863 to 0.9223, after the pair touched the upper side of the range in yesterday’s session. Direction is very unclear at this point, as momentum can change rapidly when new Brexit headlines come out, but for now, the 23.6% Fibonacci at 0.9223 seems to be a good lid for the pair.
The RSI has exited the overbought area and the stochastic is hovering around the 50-line, which could mean that further weakness may be seen in the short-term, with the 38.2% Fibonacci at 0.9040 being the next key support.
| Change in | Longs | Shorts | OI |
| Daily | 4% | 4% | 4% |
| Weekly | -38% | 83% | -4% |
EUR/JPY
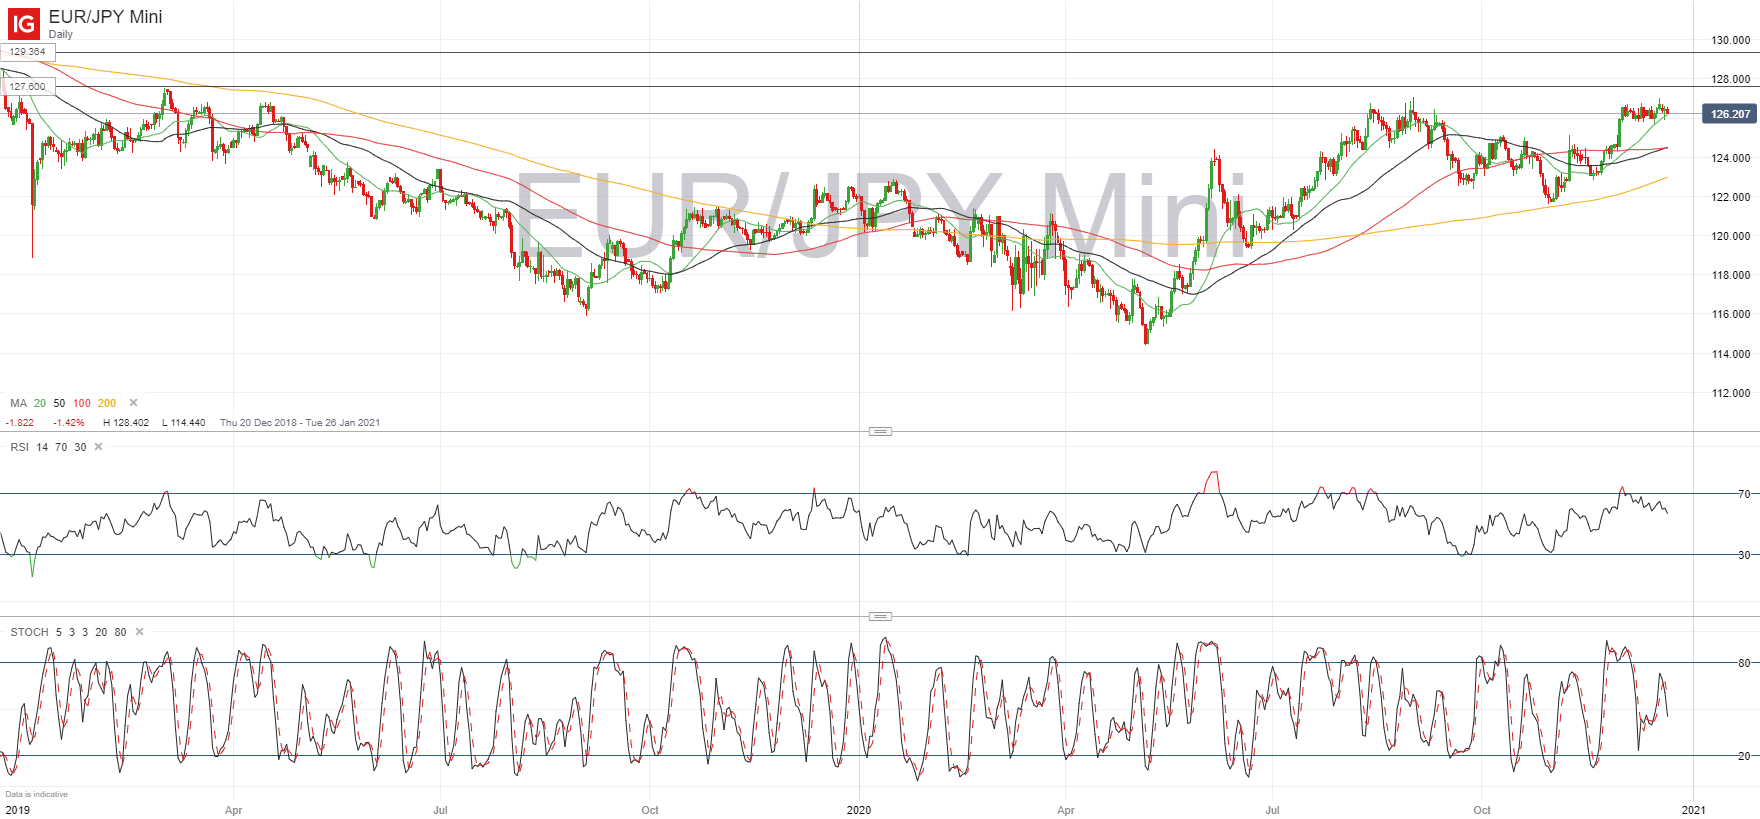
EUR/JPY has been trading with a neutral bias in the last few weeks, holding just above the 125.75 line, but momentum indicators are beginning to point to weakening support for the euro, with a bearish bias in the short-run.
On the upside, a break above 127.05 resistance would challenge the high since March 2019 at 127.60. Further buying pressure would turn short-term momentum bullish and could see 129.35 come into play as the next objective, being the highest level since November 2018.
To the downside, the 20-day moving average is acting as the main support at 126.16, followed by 125.70 before leaving EUR/JPY exposed to the 125.00 mark. Further bearish momentum could see the pair reverse the gains seen in December, falling back towards 124.45, where the 50-day and 100-day moving averages are converging.
EUR/JPY Daily Chart
| Change in | Longs | Shorts | OI |
| Daily | -4% | -1% | -2% |
| Weekly | -8% | 27% | 17% |
--- Written by Daniela Sabin Hathorn, Market Analyst
Follow Daniela on Twitter @HathornSabin