


GOLD PRICE OUTLOOK:
- Gold prices extended gains on Monday as the US Dollar hovered at a 2.5-year low
- SPDR Gold Trust (GLD) sawcontinuous outflowdespite a rebound in gold prices last week
- 80% of retail gold traders (within IG)are net long gold, whereas 20% are net short
Gold prices extended gains on Monday after rebounding from a 5-month low last week, thanks to a weaker US Dollar as well as a poorer-than-expected US nonfarm jobs number that raised hope for more stimulus. Bullion prices appear to be challenging an immediate chart resistance at US$ 1,837, where the 20-Day Simple Moving Average (SMA) line lies. Breaking this resistance may open the door for further upside potential with an eye on US$ 1,870 – a key chart resistance.
The DXY US Dollar Index, which has exhibited a relatively strong negative correlation with gold prices, is hovering at its 2.5-year low of 90.66. Their trailing 12-month correlation coefficient stood at -0.76, despite some sort of delink from end-September until early December (chart below). Recent vaccine developments failed to give the US Dollar a boost. Instead, traders appeared to believe that a worsening job market and rapidly surging coronavirus cases may allow the Federal Reserve to keep the monetary environment accommodative and call for more fiscal support. This assumption is largely in favor of precious metal prices.
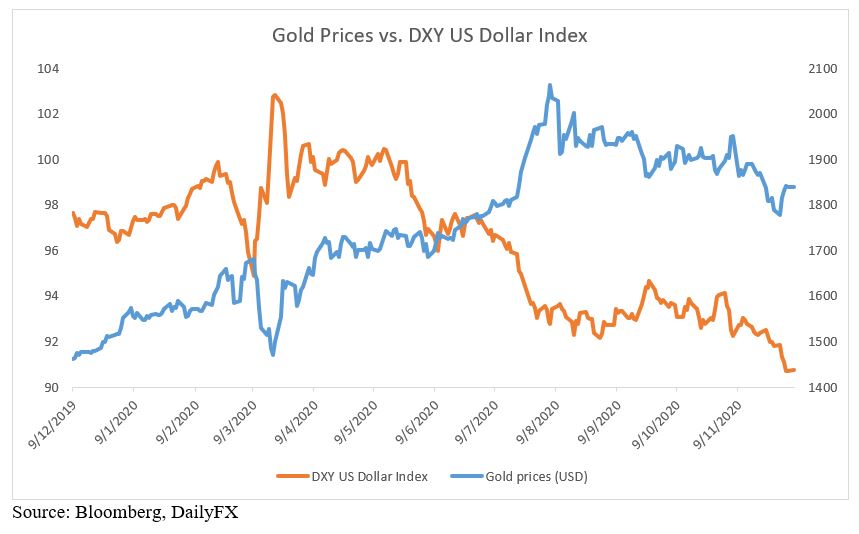
Source: Bloomberg, DailyFX
On the other hand, however, traders should be vigilant about a potential rebound in the US Dollar, which has entered technically oversold territory recently. A stronger USD may hinder gold’s upward trajectory amid an overall bearish trend. Potential catalysts for gold might include uncertainties surrounding the rollout of coronavirus vaccines across major western countries, a re-igniting of US-China tensions, as well as potential geopolitical shocks.

SPDR Gold Trust (GLD) – the world’s largest gold ETF with a market cap of US$ 69.84 billion – saw continuous outflow last week (chart below) despite a rebound in bullion prices. The falling number of GLD ETF shares means that redemptions have outpaced subscriptions, reflecting weaker demand for investment gold. The number of GLD shares outstanding has fallen from a recent peak of 437.8 million on September 21st to 405.3 million lately, marking a 11th consecutive weekly decline. Gold prices and the number of outstanding GLD shares have exhibited a strong positive correlation of 0.956 over the past 12 months (chart below).
Gold Prices vs. GLD ETF Shares Outstanding
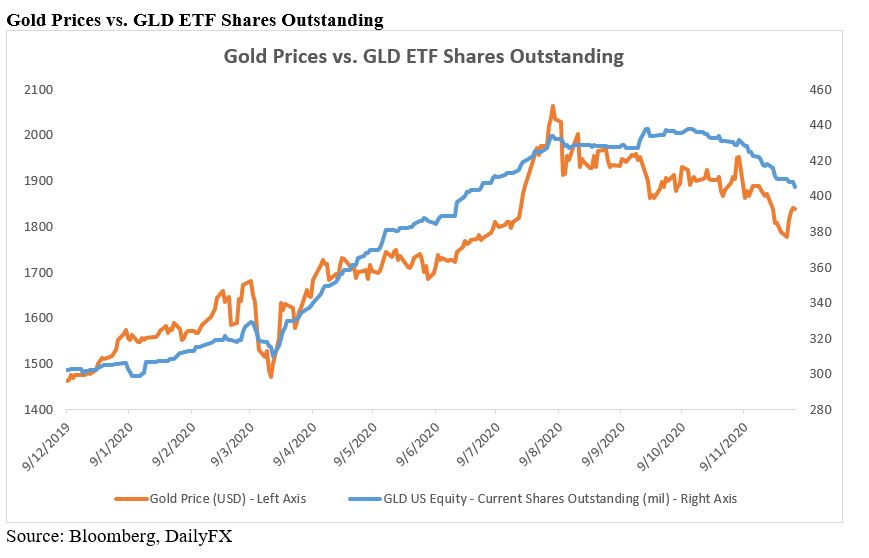
Source: Bloomberg, DailyFX
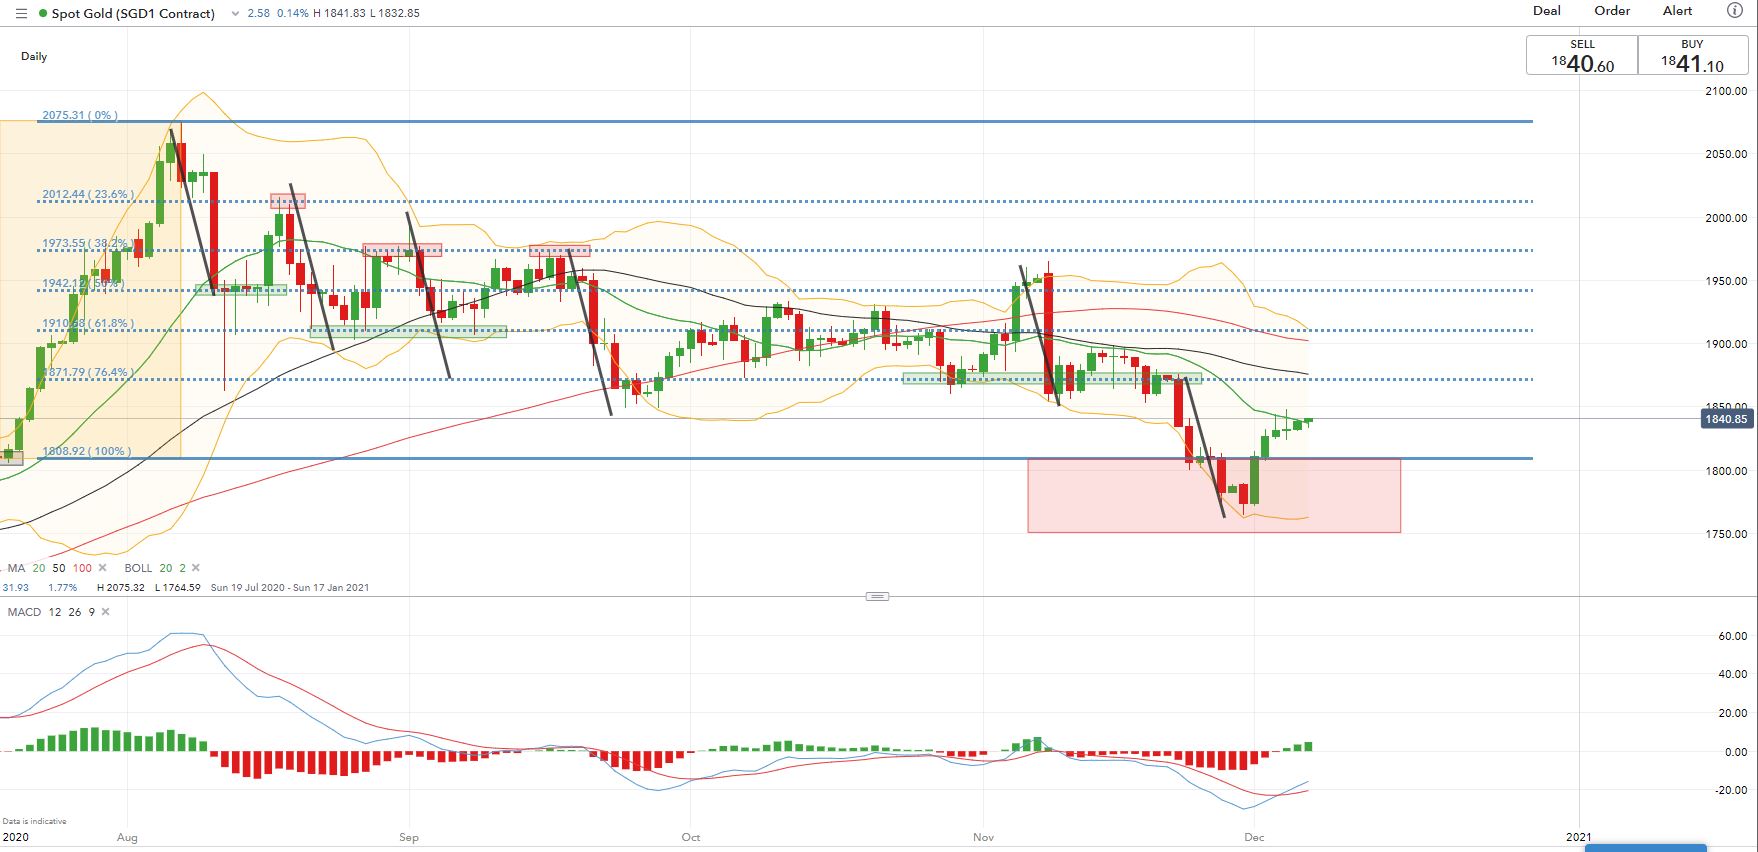
Technically, gold prices have reached an immediate resistance level at its 20-Day SMA, which is also the middle line of its Bollinger Band. Piercing through this level may signal a potential trend reversal, whereas a failed attempt may lead to another harmonic pullback with an eye on US$ 1,750 for support. The overall trend appears biased toward the downside, as suggested by consecutive lower highs and lower lows. The MACD indicator has formed a “Golden Across” although the MACD trendlines remain in the negative territory.
Gold Price – Daily Chart
| Change in | Longs | Shorts | OI |
| Daily | 3% | 3% | 3% |
| Weekly | -2% | 1% | -1% |
IG Client Sentiment indicates that retail gold traders are leaning heavily towards the long side, with 80% of positions net long, while 20% are net short. Traders have largely stayed put on long (+1%) positions and added short (+9%) bets overnight. Compared to a week ago, traders have increased both long (+2%) and short (+13%) exposure.

--- Written by Margaret Yang, Strategist for DailyFX.com
To contact Margaret, use the Comments section below or @margaretyjy on Twitter


