
FTSE 100 Price, Chart and Analysis:
- EU/UK trade talks – the point of no return?
- FTSE currently blocked by moving average resistance.
- Client sentiment suggests the FTSE may fall further.
The FTSE 100 is trying to push higher in early turnover and claw back some of this week’s losses as COVID-19 lockdowns and EU/UK trade talks continue to dominate the landscape.
Brexit Latest: GBP/USD, EUR/GBP Focused on Boris Johnson’s Decision
Away from the negative fundamental backdrop, the FTSE is also struggling to push higher with its path blocked by a cluster of moving averages which continue to force the indices lower. Add into the mix an important Fibonacci retracement level and multi-month low prints and the FTSE needs a boost of positive sentiment if it is to push higher.
Moving Averages (MA) Explained for Traders
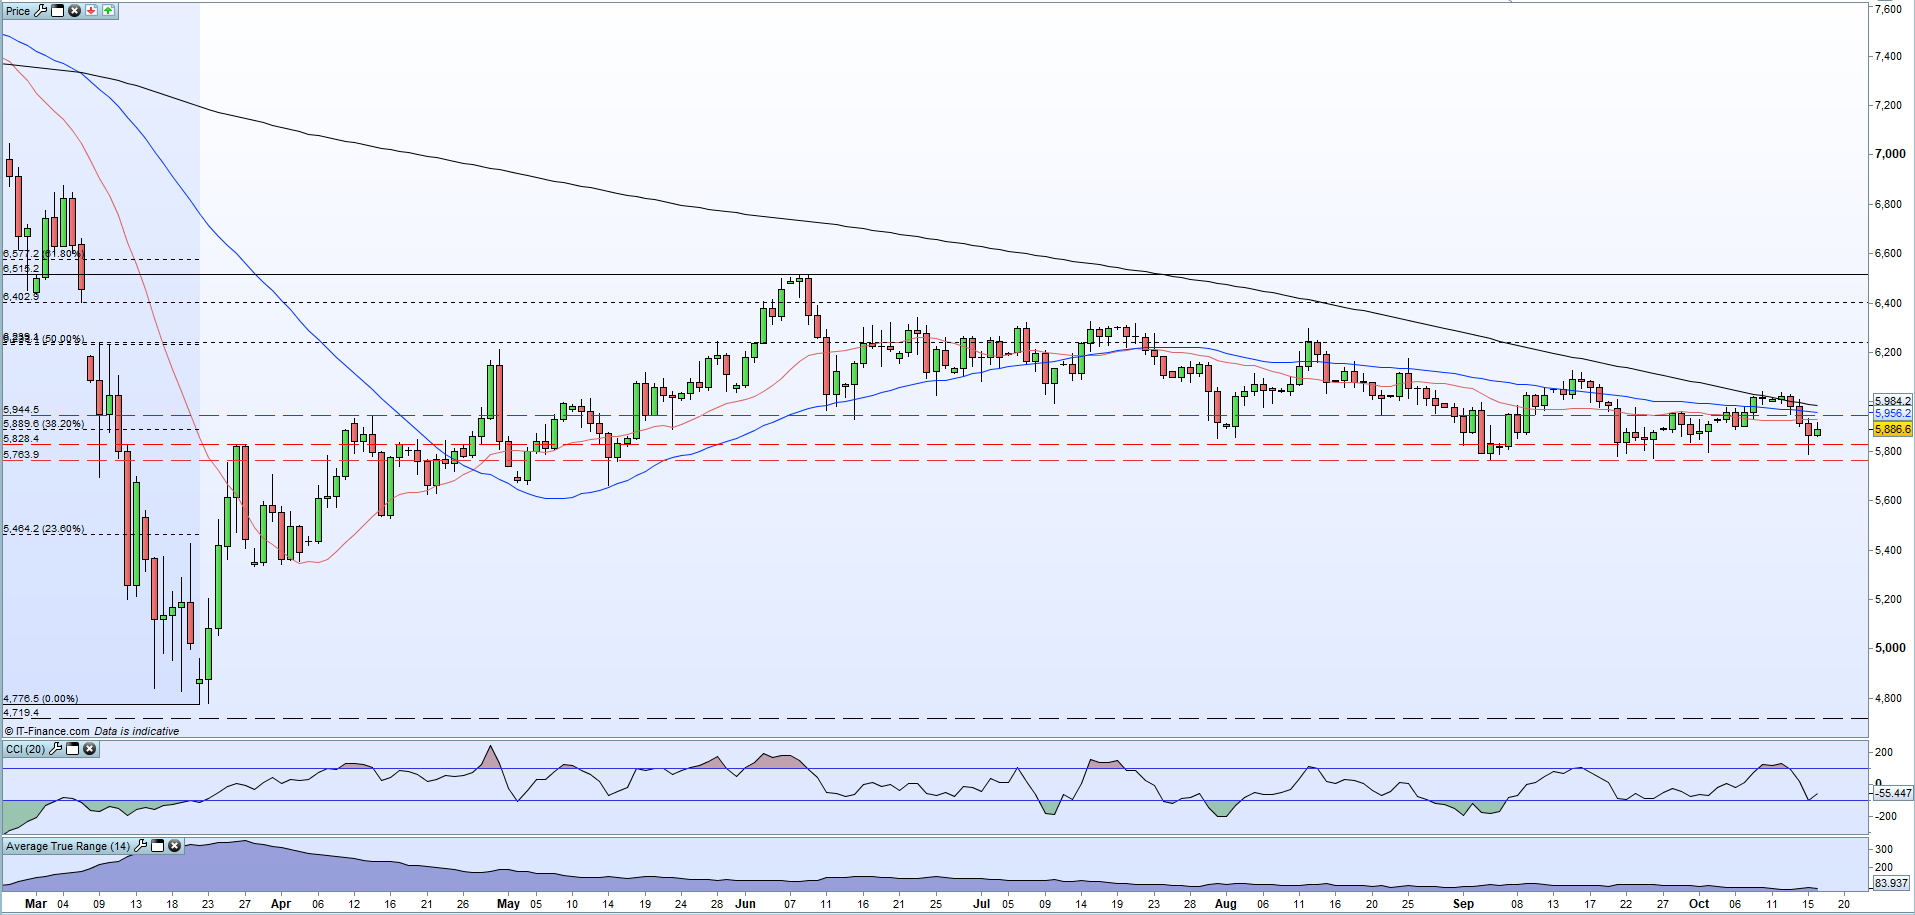
The daily chart shows the UK big board came with a few points of printing a fresh multi-month low on Thursday, although subsequent price action has been positive and strengthened that area of support. With this support seemingly in place for the short-term, the cluster of moving averages above continue to crimp price action and suggest a breakout. All three simple moving averages are within 50-55 points of each other and continue to point lower, constricting price action and leading to an imminent break. The three moving averages are clustered between 5,930 and 5,986 with the 38.2% Fib retracement at 5,889 just below. The FTSE will need a fundamental driver to force a breakout of the current technical stranglehold.

FTSE 100 Daily Price Chart (February– October 16, 2020)
| Change in | Longs | Shorts | OI |
| Daily | 3% | -2% | -1% |
| Weekly | 48% | -4% | 3% |
IG client sentiment data shows 75.84% of traders are net-long with the ratio of traders long to short at 3.14 to 1.The number of traders net-long is 12.66% higher than yesterday and 45.33% higher from last week, while the number of traders net-short is 15.43% lower than yesterday and 39.41% lower from last week.
We typically take a contrarian view to crowd sentiment, and the fact traders are net-long suggests FTSE 100 prices may continue to fall.Traders are further net-long than yesterday and last week, and the combination of current sentiment and recent changes gives us a stronger FTSE 100-bearish contrarian trading bias.
Traders of all levels and abilities will find something to help them make more informed decisions in the new and improved DailyFX Trading Education Centre
What is your view on the FTSE – bullish or bearish?? You can let us know via the form at the end of this piece or you can contact the author via Twitter @nickcawley1.