
Japanese Yen Technical Outlook, AUD/JPY, CAD/JPY, EUR/JPY – Talking Points:
- The Japanese Yen’s 5% rally from the yearly low appears to be running out of steam.
- AUD/JPY rates poised to move higher after finding support at the 200-day moving average.
- CAD/JPY eyeing a push back towards the yearly high
- EUR/JPY perched atop key support after breaking below Rising Wedge support. Are further losses in the offing?
The Japanese Yen’s 5% rally from the yearly low set at the beginning of the month could prove to be a mere counter-trend correction, as key chart resistance appears to have stifled the haven-associated currency’s surge against its major counterparts.
Japanese Yen Index** Daily Chart – 200-DMA Stifling Buying Pressure
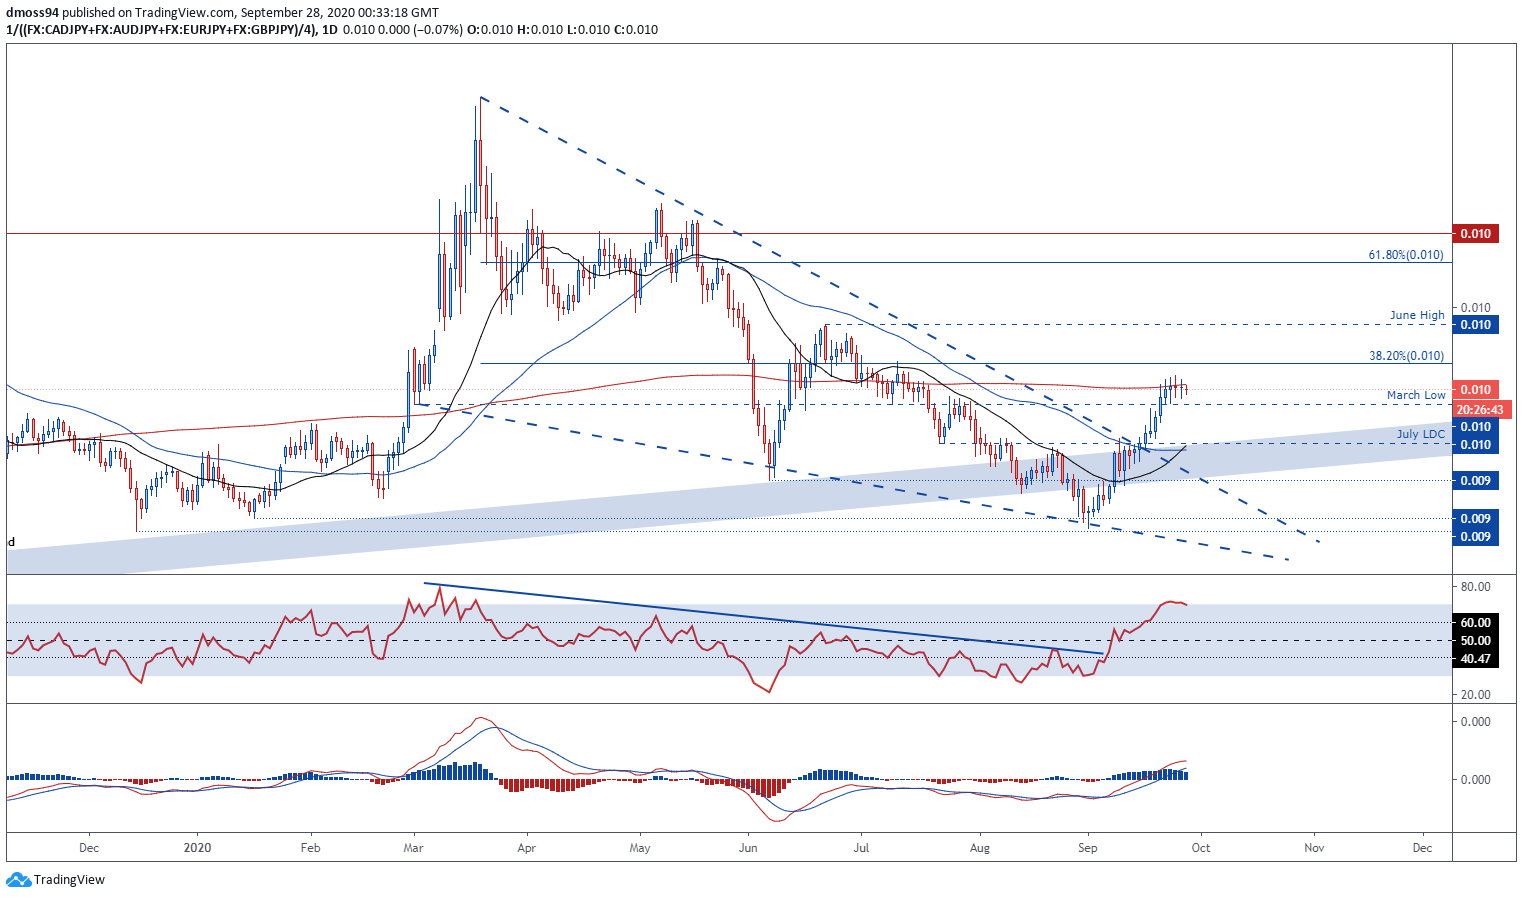
JPY Index daily chart created using TradingView
**JPY Index averages CAD/JPY, EUR/JPY, AUD/JPY, GBP/JPY
Although the Japanese Yen broke above Falling Wedge resistance and the trend-defining 50-day moving average, the inability of the RSI to scale into overbought territory is indicative of ebbing bullish momentum and could inspire a reversal back towards the yearly low, if the 200-DMA continues to stifle buying pressure.
Moreover, the MACD indicator seems to be gearing up for a bearish crossover, which could encourage would-be sellers if JPY slips back below the March low.
That being said, if support at the March low holds firm, an extension of the recent upside push looks on the cards, with a break above the 200-DMA probably validating the break of the bullish reversal pattern and carving a path to test the June high.
Nevertheless, a reversal lower looks the more likely scenario given price continues to track beneath the sentiment-defining 200-DMA.
Therefore, a push back towards the yearly low could eventuate in the coming days, if price breaks back below the March low.
AUD/JPY Daily Chart – Confluent Support Could Ignite Uptrend
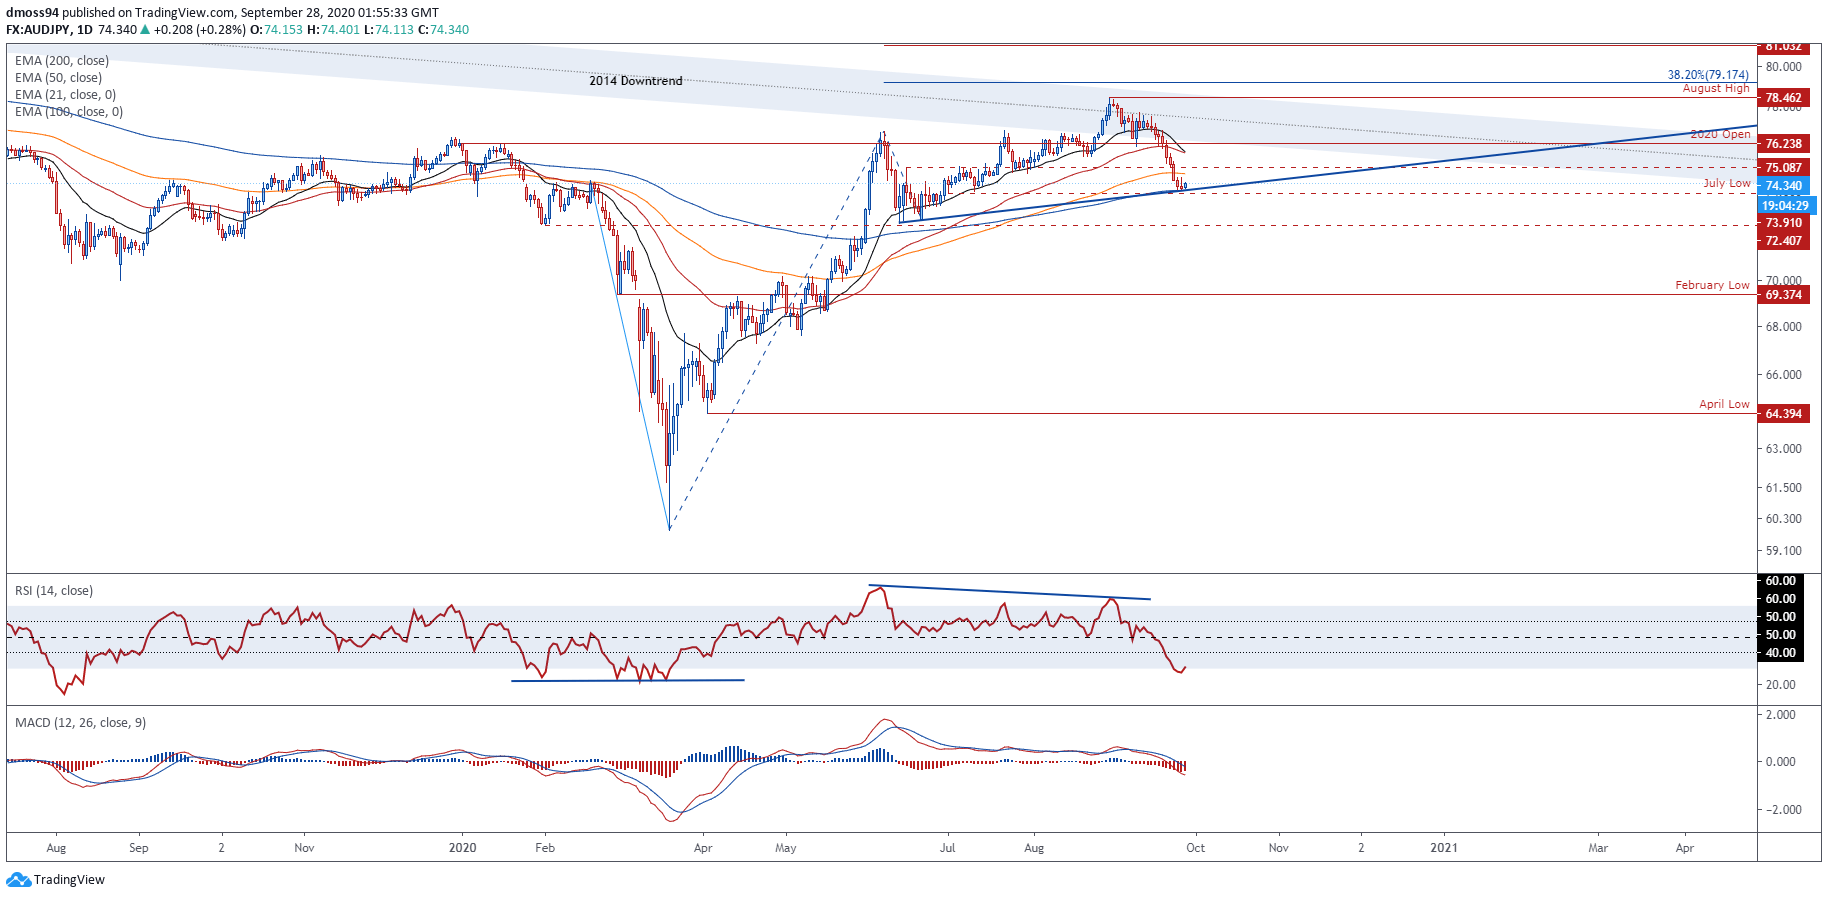
AUD/JPY daily chart created using TradingView
Despite falling over 5% from the yearly high set on August 31 (78.46) AUD/JPY appears poised to resume its primary uptrend extending from the March lows, after bouncing off confluent support at the 200-DMA and July low (73.91).
With the RSI climbing out of oversold territory and the MACD indicator pushing back towards its neutral midpoint, a retest of the yearly open (76.24) looks in the offing, if psychological support at the 74.00 level remains intact.
A daily close above the June 16 swing-high (75.08) would probably validate bullish potential and open a path to test the 2020 open (76.24) and psychologically imposing 77.00 mark.
Conversely, a break below the 74.00 level could generate a more sustained period of AUD selling and possibly bring support at the June low (72.53) into play.
| Change in | Longs | Shorts | OI |
| Daily | -12% | 6% | 0% |
| Weekly | -3% | 32% | 20% |
CAD/JPY Daily Chart – 78.6% Fibonacci Supressing Selling Pressure
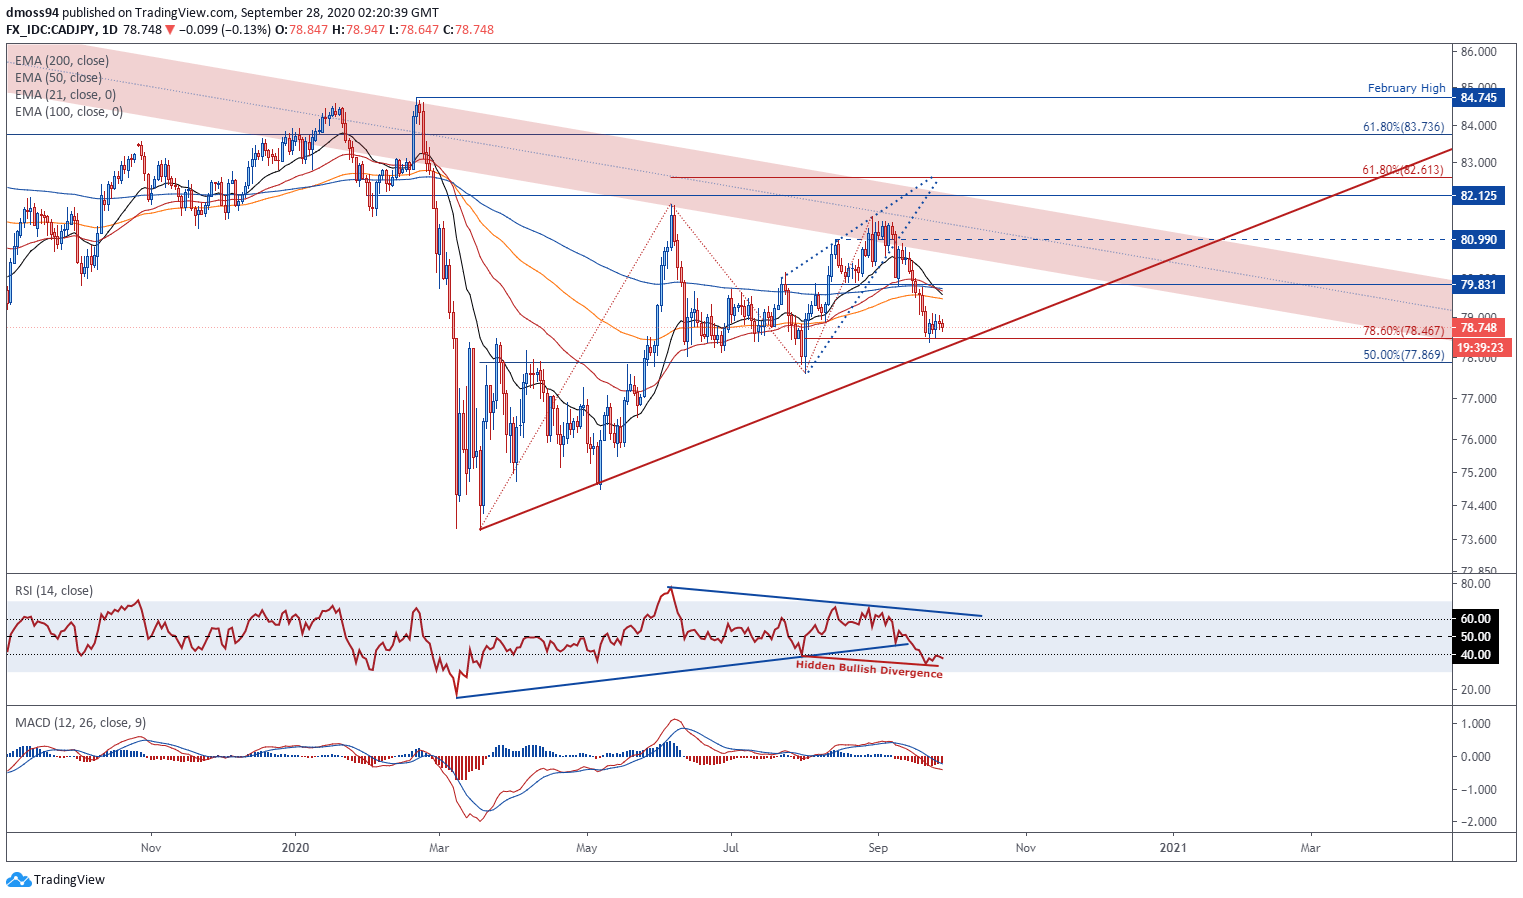
CAD/JPY daily chart created using TradingView
In a similar fashion to its AUD/JPY counterpart, CAD/JPY rates look to be gearing up for a push back towards the 200-DMA (79.75), despite falling over 3.5% from the August 28 high (81.58).
Moreover, hidden bullish RSI divergence suggests that the recent slide back to support at the 78.6% Fibonacci (78.47) could be running out of steam.
To that end, a daily close above the 79.00 level could signal the resumption of the primary uptrend and may propel price back towards the July high (80.15), with a close above the August 13 swing-high (80.99) needed to bring the February high (84.75) into focus.
On the other hand, a daily close below the 78.6% Fibonacci (78.47) and uptrend extending from the March low (74.40) would probably invalidate bullish potential and could ignite a more sustained pullback towards the yearly low (74.40).
EUR/JPY Daily Chart – July 15 Swing-High Underpinning EUR
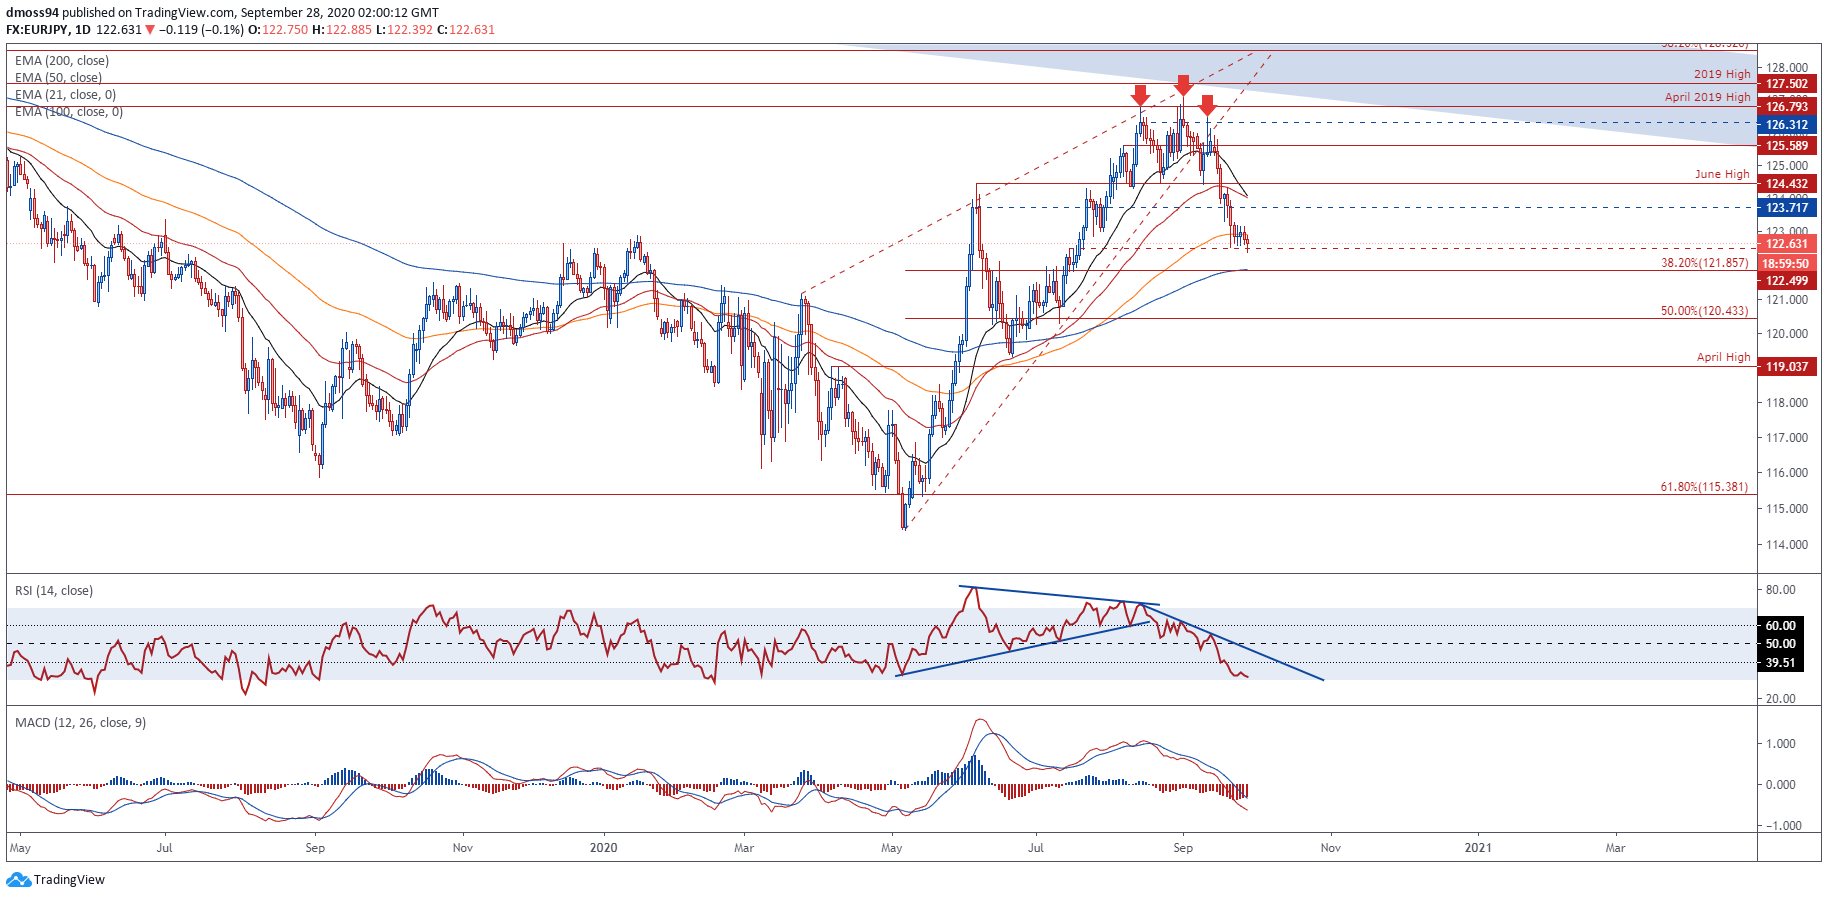
EUR/JPY daily chart created using TradingView
As mentioned in previous reports, EUR/JPY rates have pulled back significantly since breaking below Rising Wedge support and the August 6 swing-high (125.59), with price falling over 3.5% since setting the post-crisis high on September 1 (127.07).
However, EUR/JPY’s recent pullback looks to be running out of steam, as the RSI swerves away from oversold territory and the MACD histogram notably fades from its most extreme readings since late-June.
Therefore, if support at the July 15 swing-high (122.50) continues to successfully smother selling pressure a push back towards the June high (124.43) could be in the making, with a daily close above the 125.00 level probably generating a retest of the yearly high (127.07).
On the contrary, a break below psychological support at the 122.00 mark would probably open the door for a test of the sentiment-defining 200-DMA (121.87), with a daily close below possibly carving a path to test the April high (119.04).
| Change in | Longs | Shorts | OI |
| Daily | -1% | 1% | 0% |
| Weekly | -3% | 28% | 20% |
-- Written by Daniel Moss, Analyst for DailyFX
Follow me on Twitter @DanielGMoss