
Crude Oil Price, Chart and Outlook.
- Early OPEC+ meeting remains in doubt.
- Crude oil unable to make a decisive gap move.
| Change in | Longs | Shorts | OI |
| Daily | 20% | -18% | 9% |
| Weekly | 18% | -30% | 3% |
US Crude Oil Consolidating After Sharp Bounce Back.
Doubts remain whether today’s OPEC+ meeting will take place, with no official confirmation one way or another to guide traders. The meeting was originally set for June 9-10 but talk surfaced late-May that the meeting could be forward to today to announce an extension of April’s production cuts. The 9.7 million barrel per day production cut runs out at the end of June and market talk is that OPEC+ members may extend these cuts for another month to help balance faltering demand.

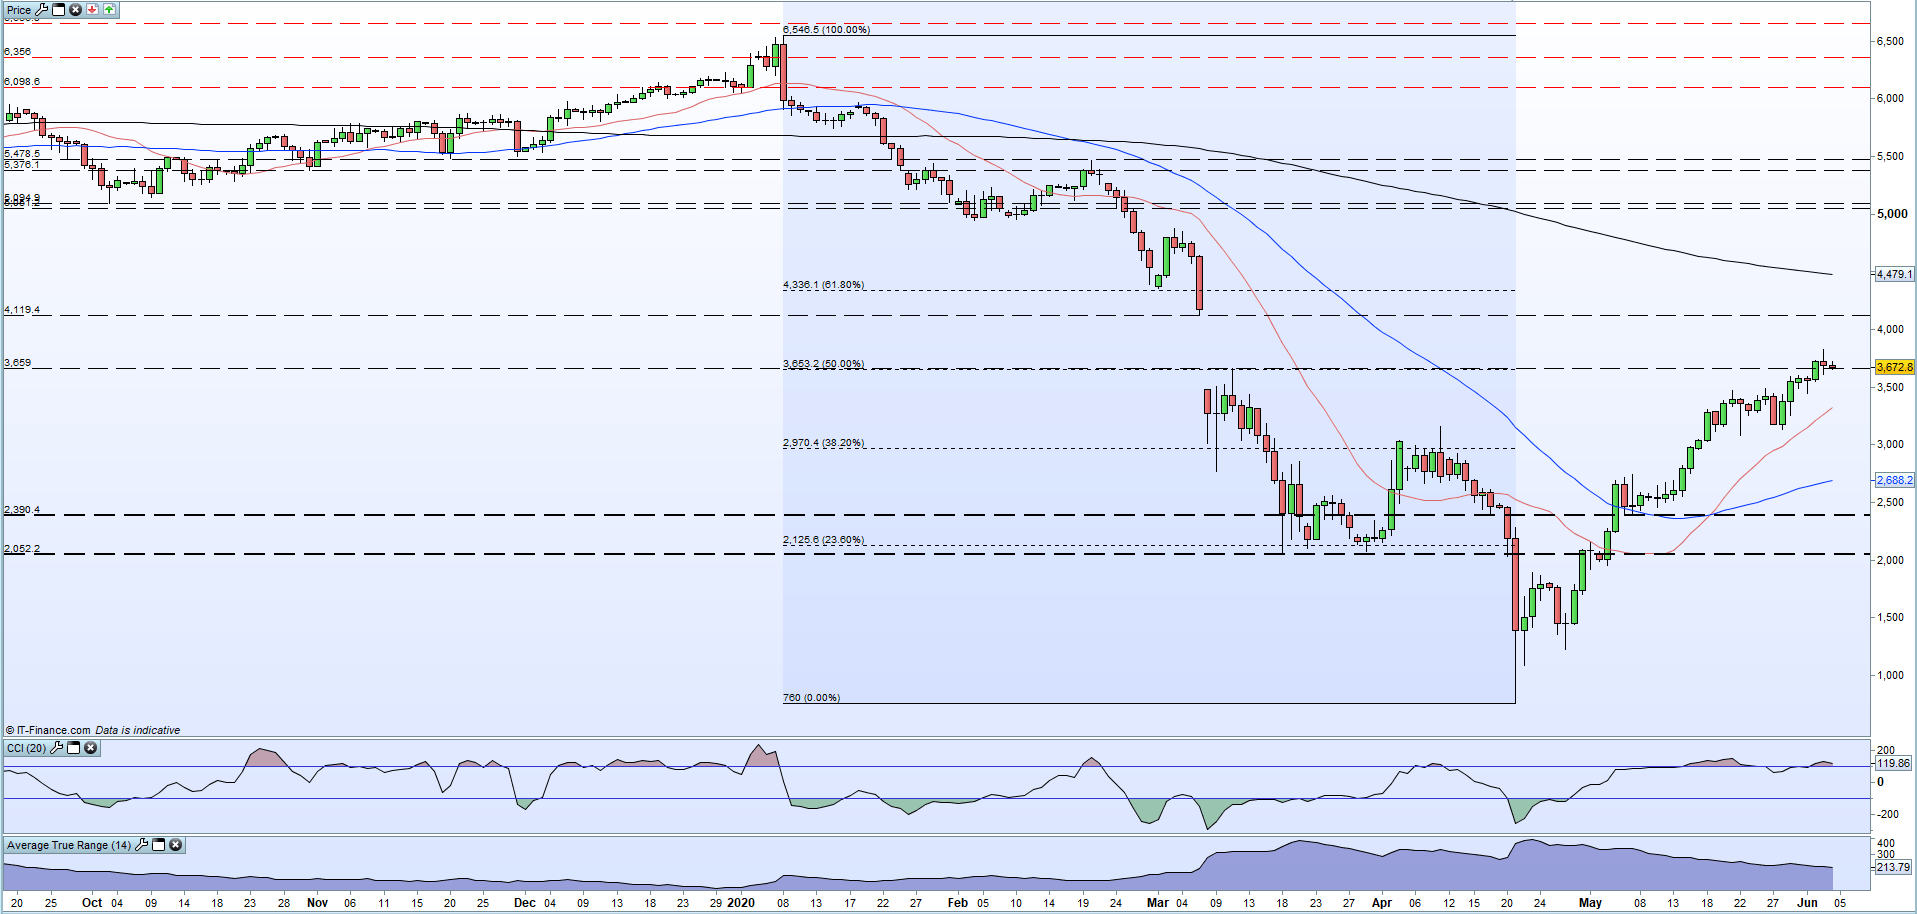
Crude oil has rebounded sharply off its late-April low with little in the way of any consolidation. A series of lower highs highlight the recent positive sentiment in the space and recent price action has taken crude to the bottom of a gap on the daily chart made between March 6 and March 11 this year. Followers of gap trading normally look for any gap to be filled as there is little in the way of support or resistance to slow the move. The daily chart shows the gap between $36.59/bbl. and $41.94/bbl. and the lower level continues to temper a full re-trace of this gap. The CCI indicator shows the oil market in overbought territory and there needs to be a positive fundamental driver to push oil higher through this resistance to faciltate further gains. If OPEC+ cuts are extended, and the market retains its overall risk-on sentiment, then a break through $41.19/bbl. would set up the 61.8% Fibonacci retracement level at $43.36/bbl. as the next target ahead of the 200-dma, currently at $44.79/bbl.
US Crude Oil Daily Price Chart (2019 – June 4, 2020)
Traders may be interested in two of our trading guides – Traits of Successful Traders and Top Trading Lessons – while technical analysts are likely to be interested in our latest Elliott Wave Guide.
What is your view on Crude Oil – bullish or bearish?? You can let us know via the form at the end of this piece or via Twitter @nickcawley1.