


Sterling and FTSE 100 - News, Prices and Analysis:

GBP/USD Pushed Lower by Ongoing US Dollar Strength
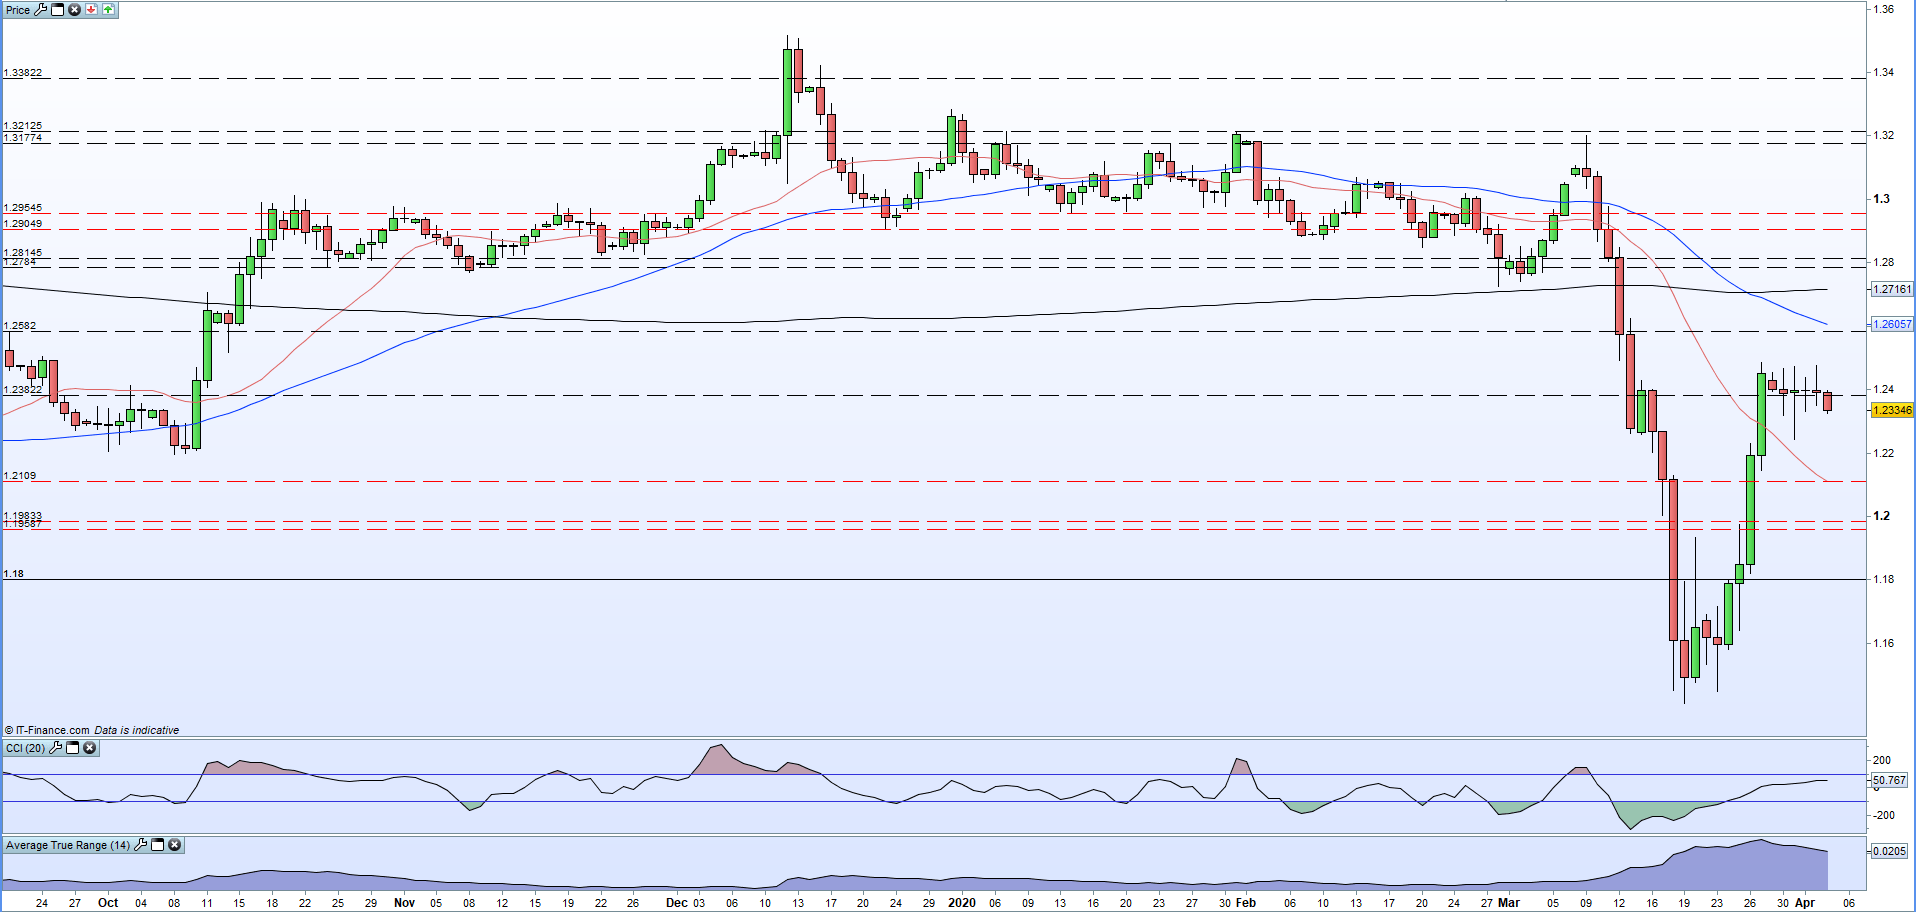
Cable is drifting lower in early trade with US dollar strength pushing the pair back down to the 1.2340 level, roughly the mid-point of this week’s trading range. Tuesday’s indecision candle – 1.2240-1.2475 – has set the marker for the week and is likely to hold going into the weekend. The British Pound has had a positive week against other currencies, including the New Zealand and Canadian dollar, while EUR/GBP is now testing important support.
GBP/USD, EUR/GBP and GBP/CAD Prices and Outlook – UK Webinar
The US dollar basket is up over two big figures since Monday’s low and current price action suggests that positive sentiment remains intact ahead of today’s US jobs report at 12:30 GMT.
Live Data Coverage of US NFPs from 12:15 GMT
GBP/USD Daily Price Chart (September 2019 – April 3, 2020)
For all market moving data and events, see the DailyFX Calendar.
| Change in | Longs | Shorts | OI |
| Daily | -4% | 2% | -1% |
| Weekly | -3% | -3% | -3% |
FTSE 100 Holding Support as Trading Range Narrows
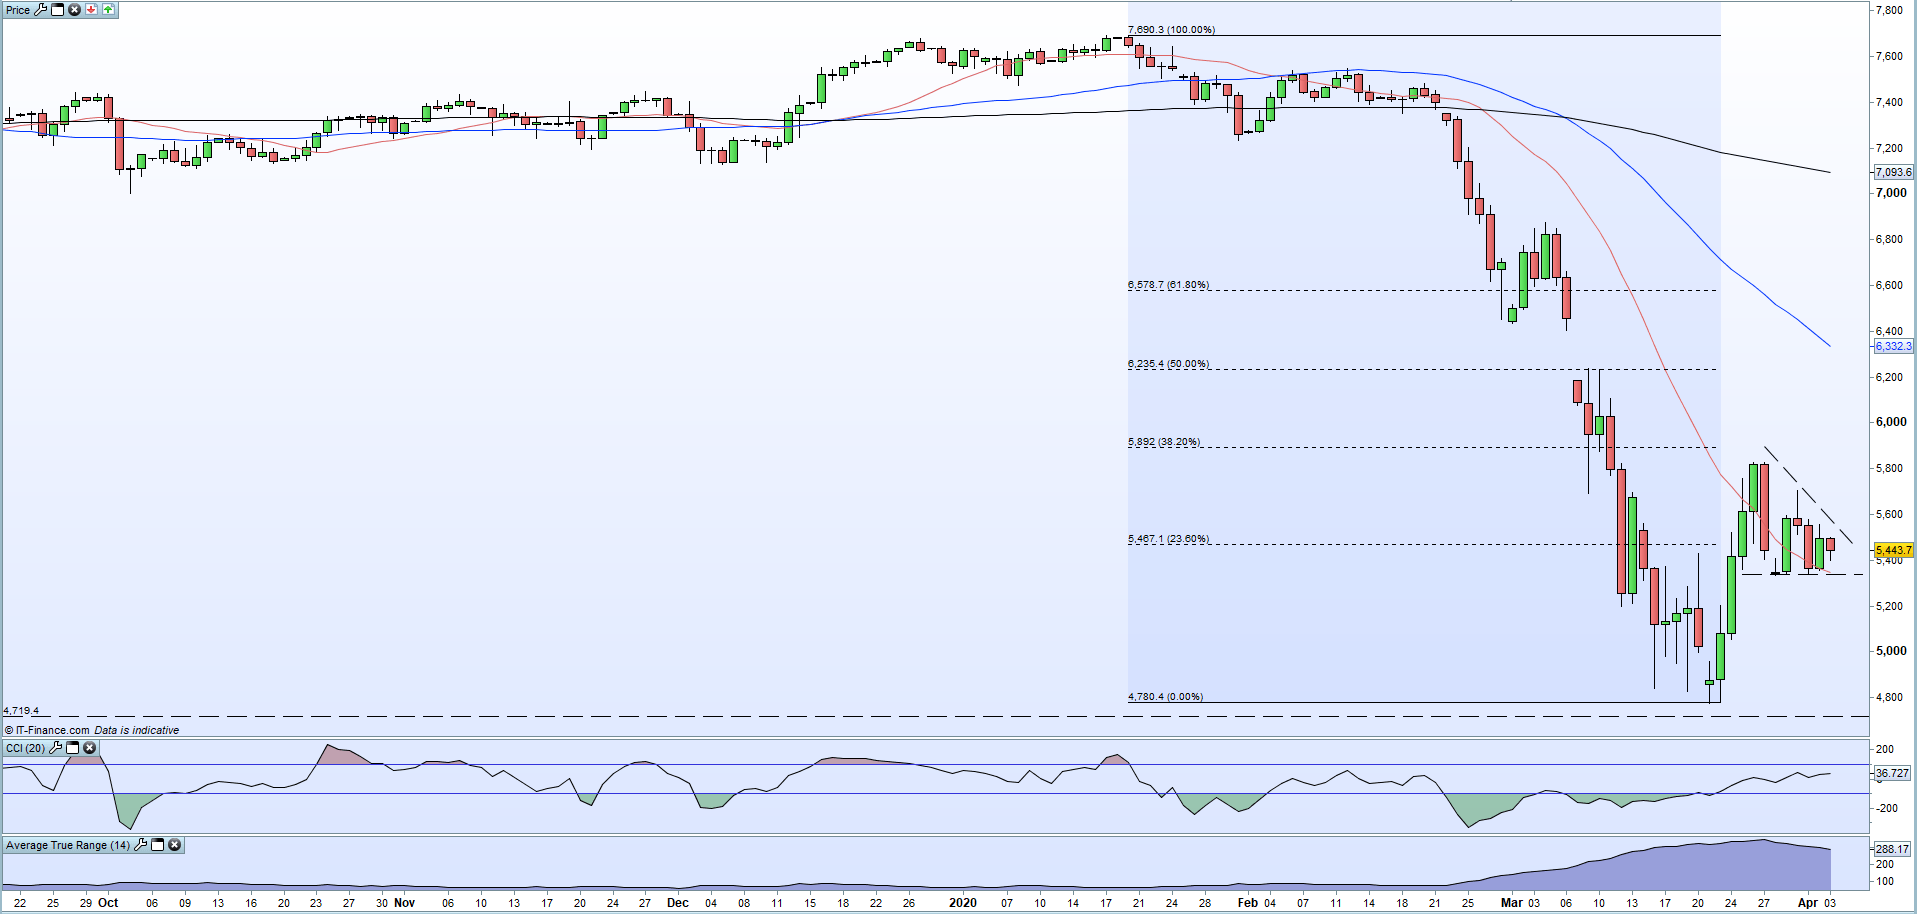
The FTSE 100 is currently forming a short-term bullish flag and the base around 5,340 needs to hold today to give the pattern further credibility. Thursday’s 5,555 high print is the initial upside target. In-between the two, the 23.6% Fibonacci retracement at 5,467 may provide support if closed above.
FTSE 100 Daily Price Chart (June 2019 – April 3, 2020)
Traders may be interested in two of our trading guides – Traits of Successful Traders and Top Trading Lessons – while technical analysts are likely to be interested in our latest Elliott Wave Guide.
What is your view on Sterling (GBP) and the FTSE 100 – bullish or bearish?? You can let us know via the form at the end of this piece or you can contact the author via Twitter @nickcawley1.


