
UK and Euro-Zone PMIs and EUR/GBP Price Analyis and Chart
- New UK PMI data highlights the weakness in the economy.
- EUR/GBP rally may be short-lived.
Brand New Q4 2019 GBP and EUR Forecast and Top Trading Opportunities
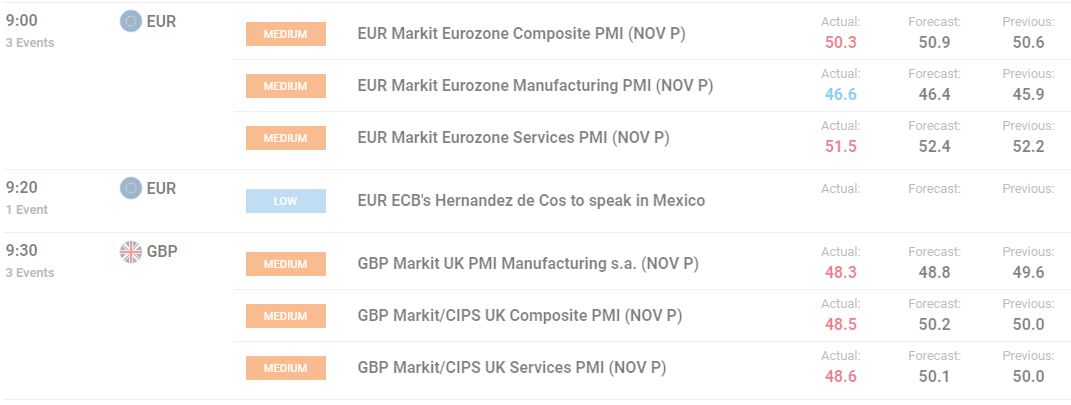
A tale of two weak currencies continues with recent data releases showing both their economies struggling. The recent PMI releases show the UK’s struggle with Brexit uncertainty continuing to hit home – with all three new flash UK PMIs below 50 – while Eurozone manufacturing picked up from lowly levels, but services fell more than expected.
EUR/GBP Price Analysis and Chart
The net outcome from today’s releases has seen EURGBP push marginally higher after its multi-month decline but the move does not look convincing yet. The pair are currently trading around the 20-day moving average, an indicator that has capped upside movement for the last six weeks, while the 50- and 200-dmas are currently at 0.86935 and 0.88410, substantially higher than the current spot price. The CCI indicator has moved out of oversold territory and is just off a six-week high.
Any pull-back in EUR/GBP will initially target Monday’s multi-month low at 0.85220 ahead of May’s low at 0.84907 and the late-March low print at 0.84725. Below here, the April 2018 low at 0.83133 beckons.
EUR/GBP Daily Price Chart (January - November 22, 2019)

IG Client Sentiment shows that traders are 65% net-long EUR/GBP, giving us a bearish contrarian bias.
Traders may be interested in two of our trading guides – Traits of Successful Traders and Top Trading Lessons – while technical analysts are likely to be interested in our latest Elliott Wave Guide.
What is your view on the Euro and Sterling – bullish or bearish?? You can let us know via the form at the end of this piece or you can contact the author at nicholas.cawley@ig.com or via Twitter @nickcawley1.