


Bitcoin (BTC) News, Price, Chart and Analysis:
- Sellers take control.
- Support and resistance levels converge.
A Guide to Day Trading Bitcoin and Other Cryptocurrencies
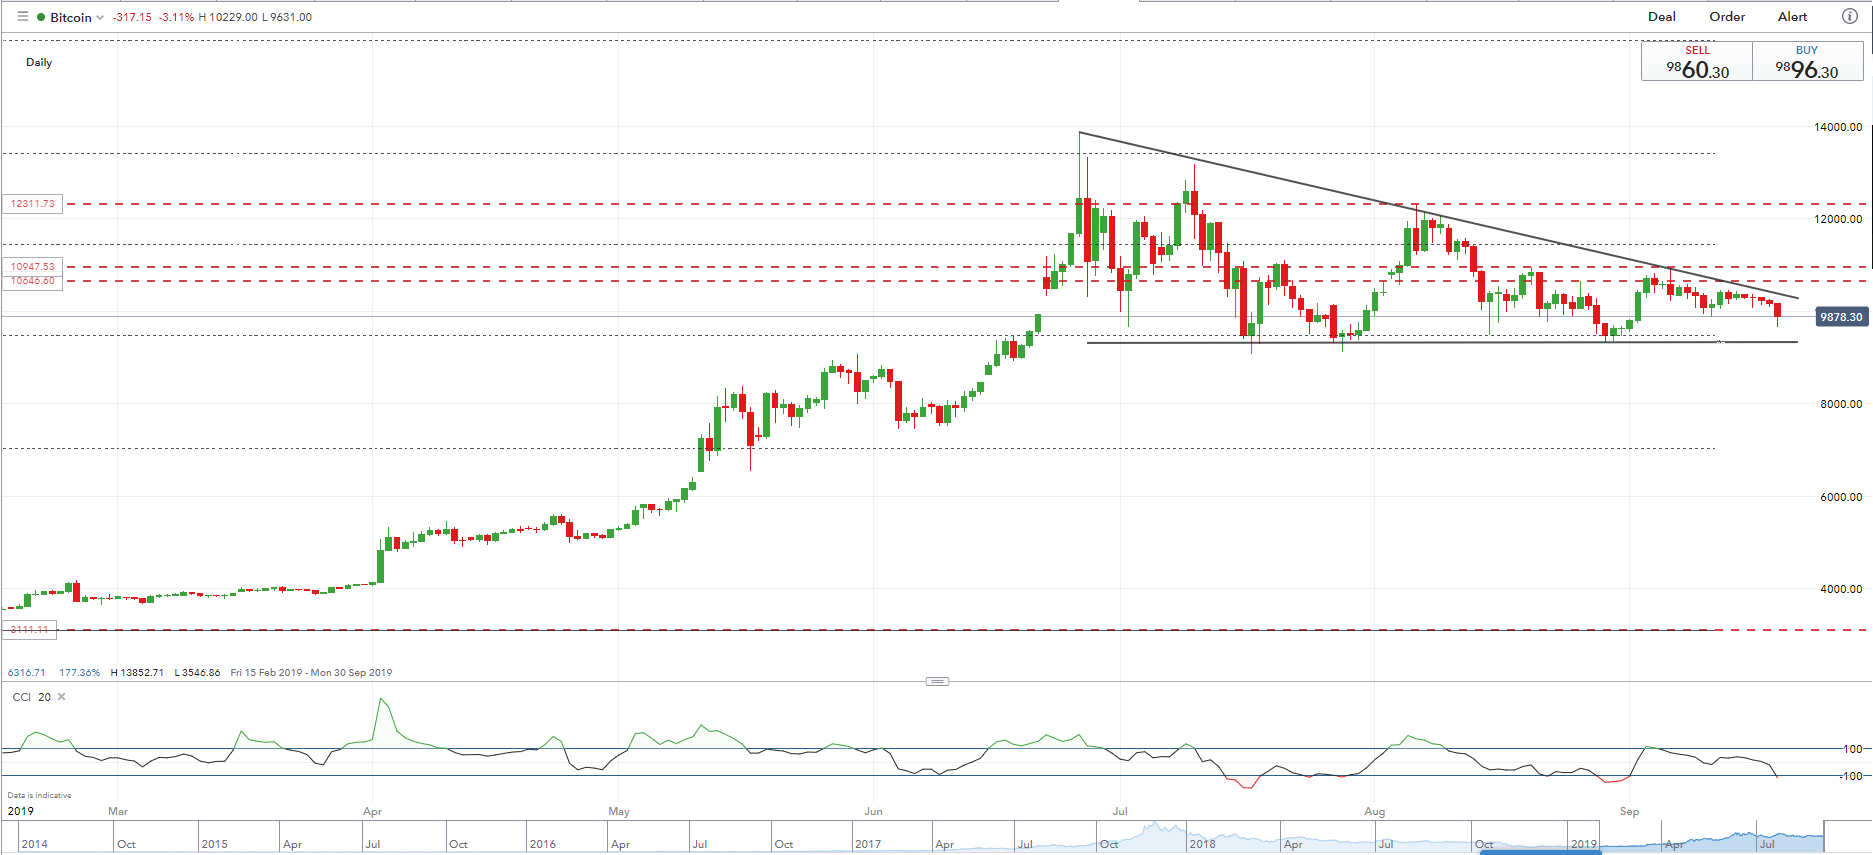
Bitcoin remains trapped in a descending triangle pattern and is currently moving towards support after rejecting trend resistance in the past few trading sessions. Today’s sell-off is the largest move in the last two-weeks and suggests that sellers are back in control. The first level of support is situated just below $9,500 before $9,325 comes into play. If BTC breaks and closes below here, there is a chance that it may retrace all the way back to the early June lows between $7,460 and $7,510. If BTC breaks and closes above trend resistance, then $11,000 comes back into play.
A descending triangle normally points to lower prices as buyer’s enthusiasm wanes, but a break higher cannot be ruled out if support continues to hold. It is likely that any break, higher or lower, will be sharp and price action volatile.
Bitcoin Price Outlook – Preparing a Move or Death by a Thousand Cuts?
Bitcoin Daily Price Chart (February – September 19, 2019)
IG Client Sentiment data show that 80% of retail traders are net-long Bitcoin (BTC), a bearish contrarian indicator.
Ethereum Outperforms Bitcoin
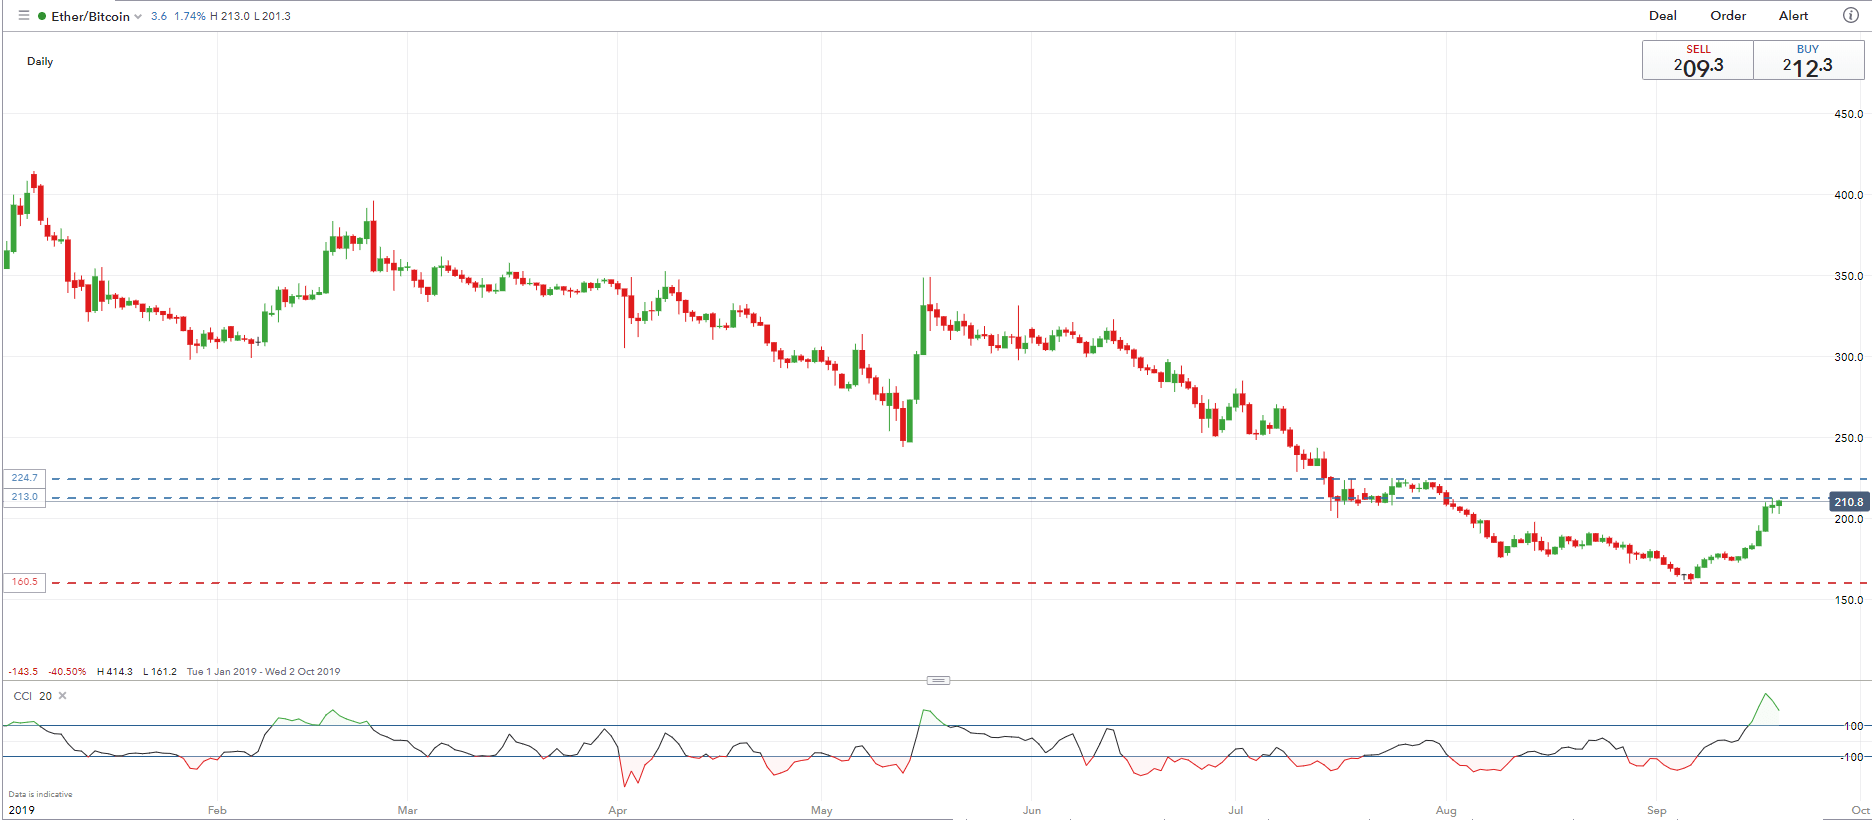
The Ethereum (ETH) versus Bitcoin (BTC) spread has rallied in the last two weeks with ETH outperforming BTC strongly. The spread traded around 160 on September 6 and is currently just below yesterday’s six-week high at 213. If ETH continues to outperform BTC, the next level of resistance for the spread is just under 225. The long-term downtrend remains in place until 225 is broken and closed above. Traders should note that the CCI indicator is also in overbought territory.
Ethereum/Bitcoin Spread (January – September 19, 2019)
Traders may be interested in two of our trading guides – Traits of Successful Traders and Top Trading Lessons – while technical analysts are likely to be interested in our latest Elliott Wave Guide.
What is your view on Bitcoin and Ethereum – bullish or bearish?? You can let us know via the form at the end of this piece or you can contact the author at nicholas.cawley@ig.com or via Twitter @nickcawley1.


