


US Dollar Talking Points:
- The economic calendar brings some notable items of interest around the US Dollar. October CPI numbers have already been released, and later this morning marks the start of FOMC Chair Jerome Powell’s two-day testimony on Capitol Hill.
- After a strong sell-off in October USD bulls have come back in November, wiping out 50% of last month’s sell-off on the way up to a confluent zone of resistance. That resistance has held since last Friday but buyers have slowly started to get more aggressive, leading to the build of an ascending triangle that will often be approached with the aim of bullish breakouts.
- DailyFX Forecasts are published on a variety of markets such asthe US Dollar or the Euro and are available from the DailyFX Trading Guides page.
US Dollar in the Spotlight After CPI, Ahead of Powell Testimony
It’s a big day for the US Dollar with two very different yet very meaningful drivers on the economic calendar hitting the headlines. The first of which was the release of October CPI numbers out of the US which was discussed earlier by Rich Dvorak; and this is followed by the start of FOMC Chair Jerome Powell’s Humphrey Hawkins testimony on Capitol Hill set for 11am ET.
The latter of those drivers is especially important at the moment as the most recent FOMC rate decision provided a major boost to the risk trade, driving the S&P 500 to fresh all-time-highs above the 3100 level. Last Thursday Ten-Year Treasury Yields ticked above 1.95% for the first time in three months, and this came as the FOMC presented a posture of patience, pledging not to hike rates unless inflation showed a ‘really significant’ improvement. The next inflation data point was released this morning with October CPI numbers coming in slightly above expectations, printing at 1.8% versus the expectation for 1.7%.
October CPI out of the United States
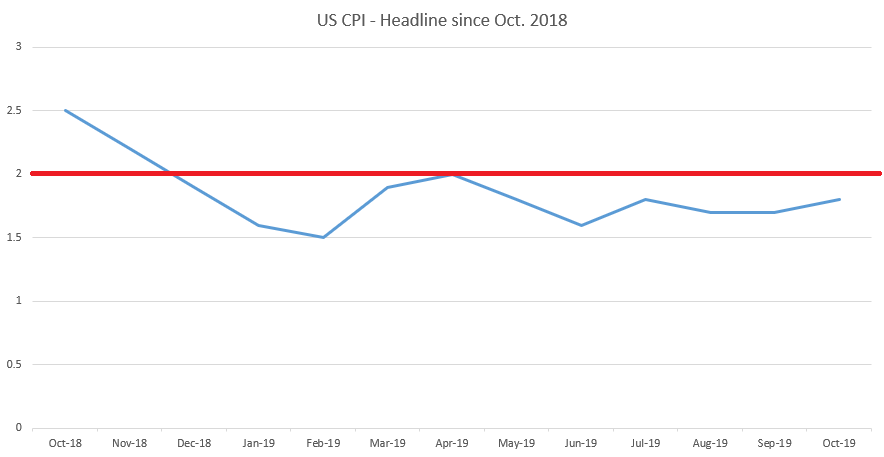
Core CPI, stripping out food and energy, has remained strong over the past couple of years, printing above 2% for 19 consecutive months coming into this morning. Of recent, Core CPI has been at 2.4% over the past two months, and this morning saw a bit of moderation as Core CPI printed at 2.3% versus the expectation for another 2.4% print.
Core CPI Chart

What Does This Mean for the US Dollar?
As mentioned earlier, there is another driver set to hit the headlines a little later this morning so the US Dollar is unlikely to be quiet for the remainder of Wednesday trade. Chair Powell also testifies in front of Congress tomorrow as day two of that testimony, and Friday brings Advance Retail Sales out of the US, so there’s a plethora of potential for volatility around the USD.
Coming into this morning the US Dollar is holding at a very key area of resistance. This is the same zone that previously held yearly and two-year-highs in April and June of this year, showing around the 98.33 level in DXY. This zone offered a brief amount of support in October as sellers were taking-control of the USD but this was a mere pause point as that bearish pressure continued. November has so far brought a far different change of pace and buyers have clawed back 50% of that prior sell-off.
I had looked at a similar scenario with a similar formation in the US Dollar last Thursday, just ahead of that topside breakout.
The US Dollar has now held resistance in this confluent zone since last Friday. Each response to that resistance, however, has had a weaker impact, leading to the build of a bullish trendline. When combining that horizontal resistance with the rising trendline, this produces an ascending triangle formation that will often be approached with the aim of bullish breakouts.
US Dollar Two-Hour Price Chart
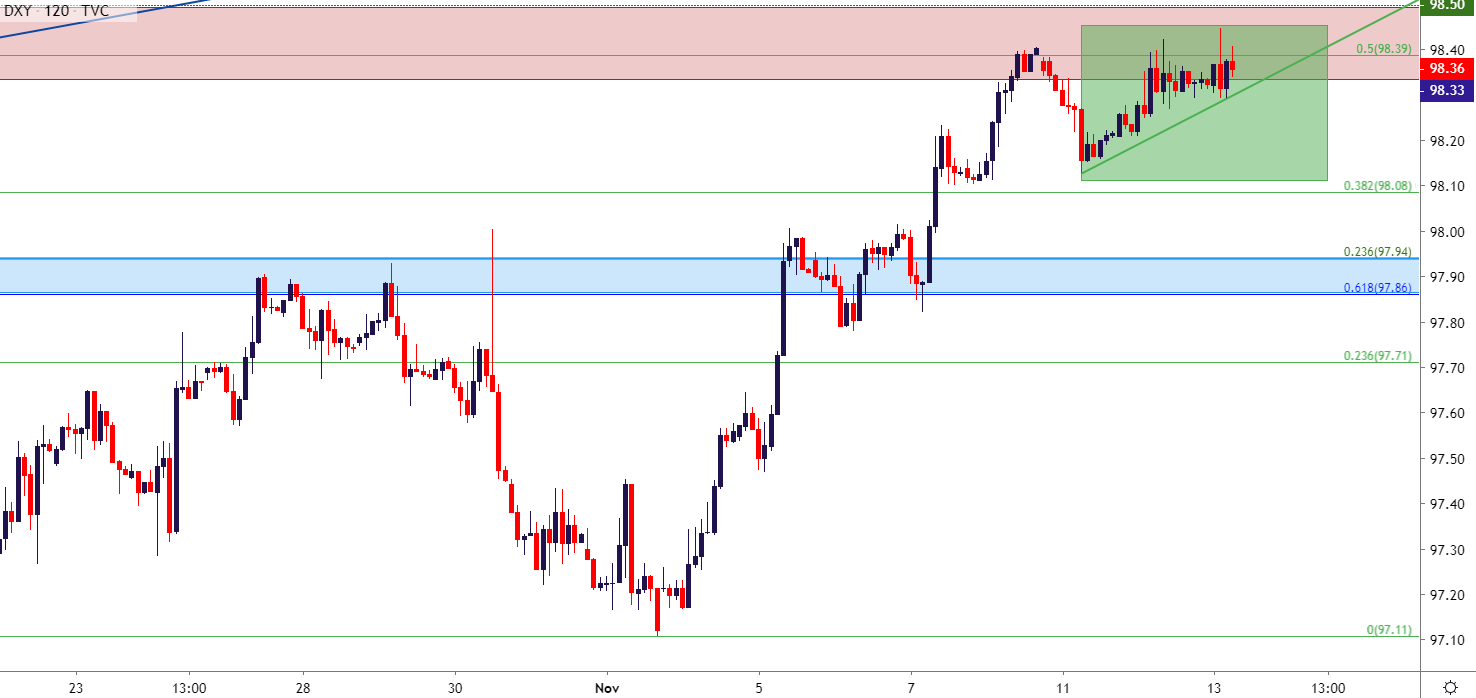
Chart prepared by James Stanley; US Dollar on Tradingview
USD – Levels to Know
If a bullish breakout does catch, the next area of interest on the DXY chart runs from 98.64-98.69. On the support side of the equation, if this formation does falter and buyers are unable to extend the breakout, the next spot of interest runs from 98.08-98.13; and below that the prior zone of support resistance from 97.86-97.94 comes in to play.
US Dollar Four-Hour Price Chart
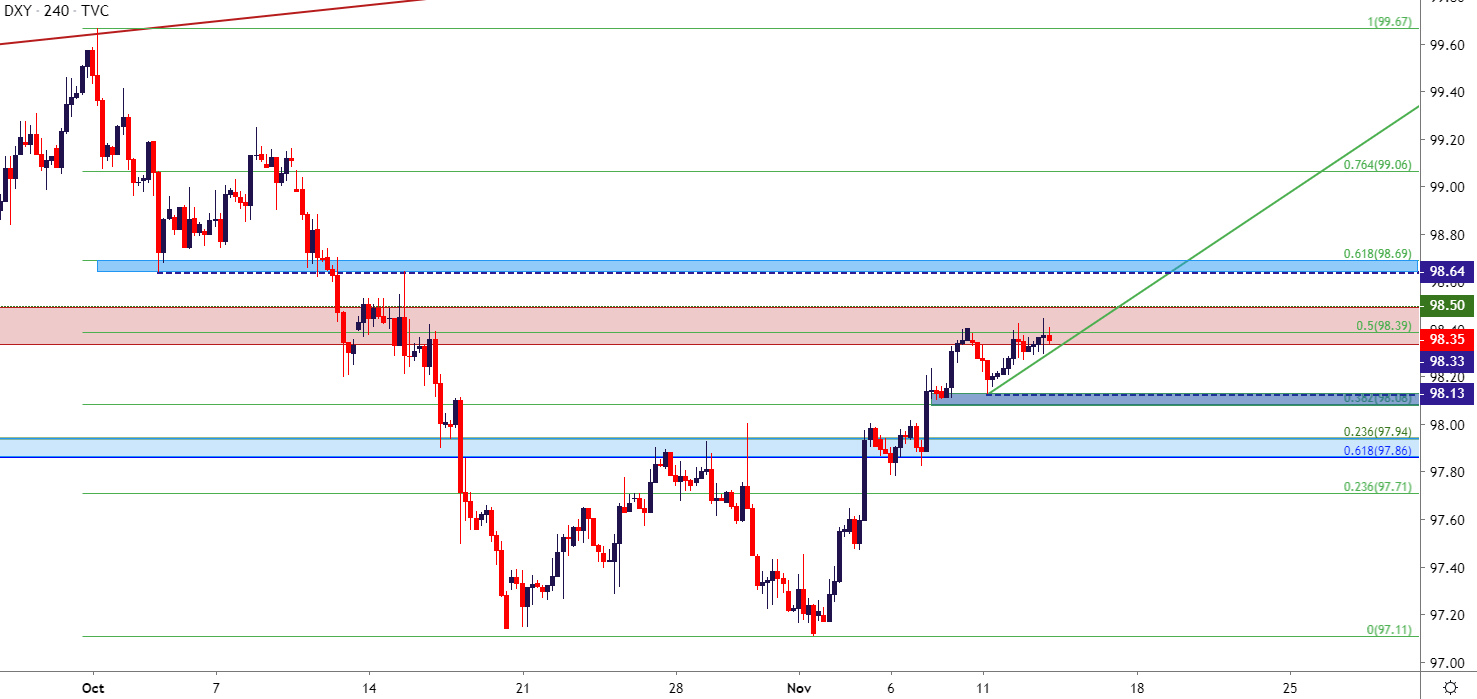
Chart prepared by James Stanley; US Dollar on Tradingview
To read more:
DailyFX offers an abundance of tools, indicators and resources to help traders. For those looking for trading ideas, our IG Client Sentiment shows the positioning of retail traders with actual live trades and positions. Our trading guides bring our DailyFX Quarterly Forecasts and our Top Trading Opportunities; and our real-time news feed has intra-day interactions from the DailyFX team. And if you’re looking for real-time analysis, our DailyFX Webinars offer numerous sessions each week in which you can see how and why we’re looking at what we’re looking at.
If you’re looking for educational information, our New to FX guide is there to help new(er) traders while our Traits of Successful Traders research is built to help sharpen the skill set by focusing on risk and trade management.
--- Written by James Stanley, Strategist for DailyFX.com
Contact and follow James on Twitter: @JStanleyFX


