


Gold Technical Analysis Talking Points:
- Gold prices have fallen-back after last week’s test of long-term resistance.
- The bigger-picture bullish trend in Gold remains on pause after last week’s FOMC.
- DailyFX Forecasts are published on a variety of markets such as Gold, the US Dollar or the Euro and are available from the DailyFX Trading Guides page. If you’re looking to improve your trading approach, check out Traits of Successful Traders. And if you’re looking for an introductory primer to the Forex market, check out our New to FX Guide.
Gold Folds from Key Resistance, Trips Back Down to Support
Last week’s run of US Dollar weakness helped to push Gold up to a key area of resistance. This is the same zone that’s helped to hold buyers at bay since the bullish breakout went on pause a couple of months ago and more recently, this zone has helped to build in a series of lower-highs.
As looked at on Monday, Gold price action had built into a short-term range after that longer-term resistance test, with support showing around the 1474-1480 area on the chart. As shared in that report, given the posturing at the resistance zone, traders looking at bullish strategies in Gold would likely want to either wait for a pullback to support or a breakout to indicate that bulls were ready to push the matter. The former of those scenarios is in the process of taking place as yesterday’s dip in Gold prices brought into play the area of range support that’s held the lows since early-October.
Gold Four-Hour Price Chart
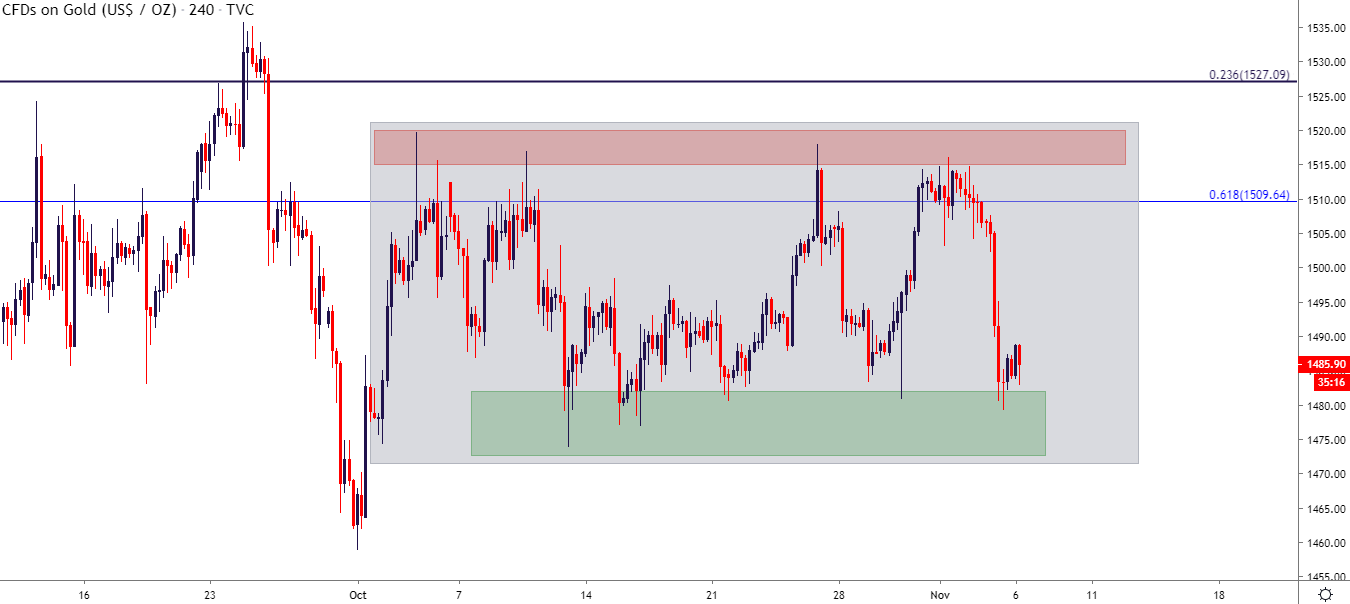
Chart prepared by James Stanley; Gold on Tradingview
As looked at multiple times in the recent past, the longer-term backdrop in Gold remains bullish in nature with price action currently caught in a range of digestion similar to what took place in February-May of this year. In that prior episode, a falling wedge had formed as prices pulled back for three months before launching higher. At this stage, a bull flag had formed and buyers have already shown a couple of different failed tests through resistance.
Gold Daily Price Chart: Trend Digestion
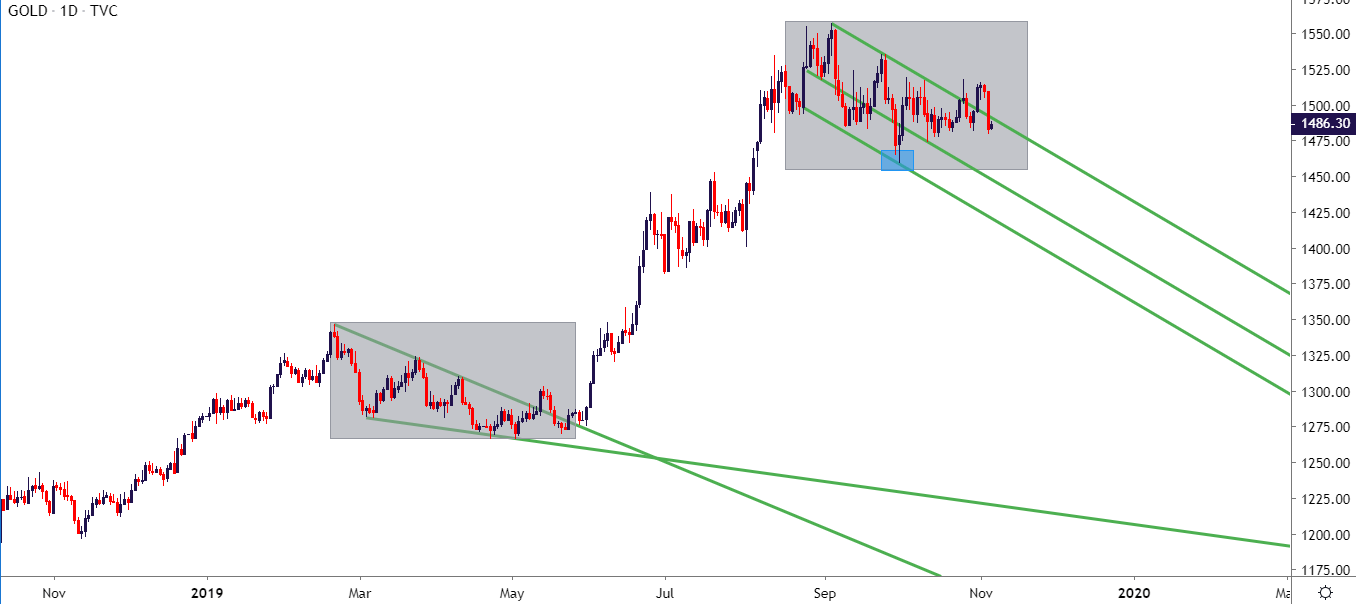
Chart prepared by James Stanley; Gold on Tradingview
Gold Bullish Themes – Is Now the Time?
The bullish theme in Gold has run alongside FOMC expectations this year, with that recent breakout that started in June and ran through August taking place as the FOMC was laying the groundwork for incoming rate cuts. The bank has now cut three times in as many meetings but, at the last cut, implied that this would be the last move until something changed. And given the vulnerability of global markets to themes such as trade wars or politics, that change can happen very fast.
The big question remains – when will the bullish trend in Gold move into continuation? This will likely sync with an FOMC shift, at some point, and will probably pop up when many are least expecting it. So, as discussed in yesterday’s webinar, this comes down to an element of anticipation, and that’s likely playing somewhat of a role in the current zone of support in Gold.
The current range can be approached with a prior trend-side bias, looking to buy at support while scaling-out at resistance coupled with a break-even stop. If the breakout does happen, fantastic but, if it doesn’t break-even stops can protect the remainder of the position.
Gold Price Eight-Hour Chart
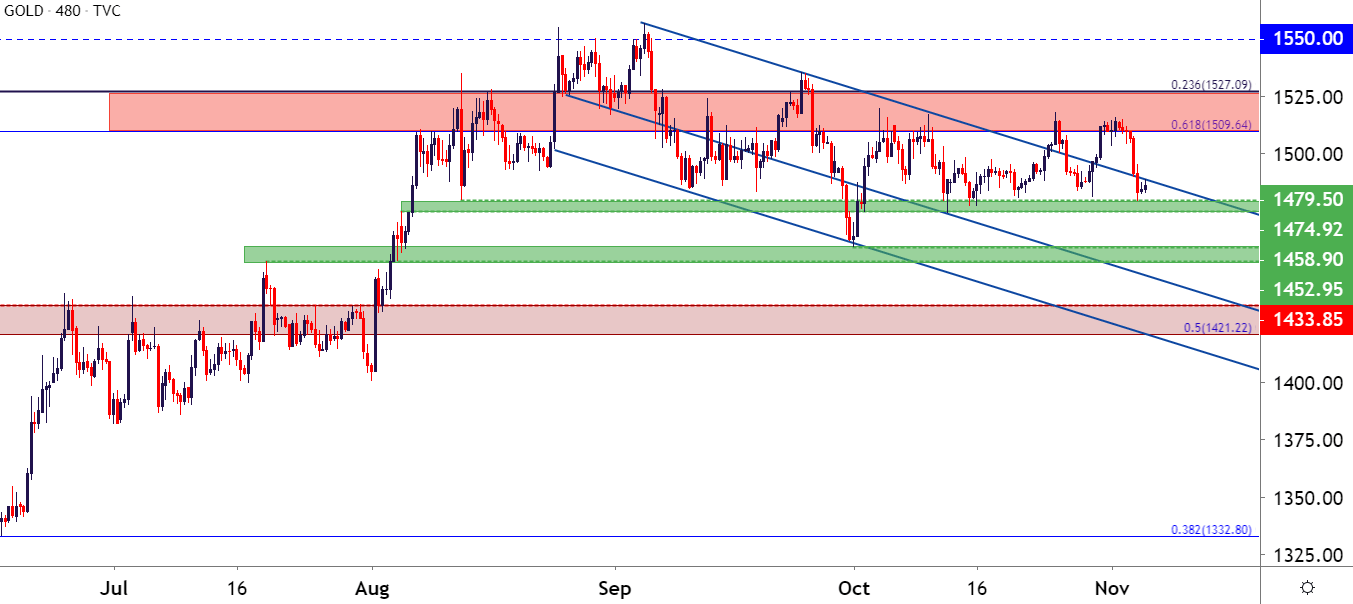
Chart prepared by James Stanley; Gold on Tradingview
To read more:
Are you looking for longer-term analysis on the U.S. Dollar? Our DailyFX Forecasts have a section for each major currency, and we also offer a plethora of resources on Gold or USD-pairs such as EUR/USD, GBP/USD, USD/JPY, AUD/USD. Traders can also stay up with near-term positioning via our IG Client Sentiment Indicator.
Forex Trading Resources
DailyFX offers an abundance of tools, indicators and resources to help traders. For those looking for trading ideas, our IG Client Sentiment shows the positioning of retail traders with actual live trades and positions. Our trading guides bring our DailyFX Quarterly Forecasts and our Top Trading Opportunities; and our real-time news feed has intra-day interactions from the DailyFX team. And if you’re looking for real-time analysis, our DailyFX Webinars offer numerous sessions each week in which you can see how and why we’re looking at what we’re looking at.
If you’re looking for educational information, our New to FX guide is there to help new(er) traders while our Traits of Successful Traders research is built to help sharpen the skill set by focusing on risk and trade management.
--- Written by James Stanley, Strategist for DailyFX.com
Contact and follow James on Twitter: @JStanleyFX


