


CRUDE OIL OUTLOOK:
- Crude oil prices drop despite large inventories draw as gasoline stocks rise
- Technical positioning warns that a Double Top may be forming near $68/bbl
- Thin data docket, flat risk trends hint at consolidation before US jobs data
Crude oil prices fell despite a EIA data showing a larger-than-expected outflow from US inventories last week. The report revealed a draw of 7.99 million barrels, a decline nearly three times larger than the expected 2.35-million-barrel reduction envisioned by analysts.
Selling pressure appeared to reflect an unexpected build in gasoline stocks. Inventories added 737k barrels, marking the fifth consecutive week of gains. Tellingly, measures of implied demand for crude, gasoline and distillates all declined in parallel, telegraphing a weaker read on end-product uptake.
Looking ahead, a relatively subdued offering on the economic data coupled with a limp lead from broader sentiment trends – bellwether S&P 500 index futures are trading conspicuously flat – speaks to a consolidative session. Traders may opt for a wait-and-see posture ahead of Friday’s much-anticipated US jobs report.

CRUDE OIL TECHNICAL ANALYSIS
Crude oil prices have found their way back to trend-defining resistance in the $66-68 area. Negative RSI divergence hints that upside momentum is fading, which may set the stage for the formation of a bearish Double Top pattern.
The first step toward confirmation would be a daily close below initial support at 63.53. The next downside hurdle comes in at 60.61. Completing the Double Top calls for a breach of the pattern’s neckline at 57.25. That would imply a measured downside move below the $47 figure to follow.
Alternatively, establishing a foothold above the $68 handle would neutralize bearish technical cues and set the stage for the next leg higher. The 38.2% Fibonacci expansionat 70.37 approximates initial resistance, followed by the 50% threshold at 74.42.
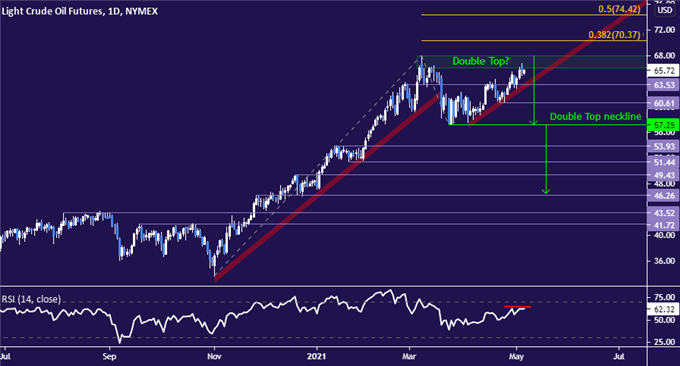
Crude oil price chart created using TradingView
COMMODITY TRADING RESOURCES
- What is your trading personality? Take our quiz to find out
- See our guide to build confidence in your trading strategy
- Join a free live webinar and have your questions answered
--- Written by Ilya Spivak, Head Strategist, APAC for DailyFX
To contact Ilya, use the comments section below or @IlyaSpivak on Twitter


