


Silver, XAG/USD, Crude Oil, Saudi Arabia, Treasury Yields, Commodities Briefing - Talking Points:
- Silver and gold prices weakened on Monday as US Dollar gained
- WTI prices brushed aside attack on key Saudi Arabian oil facility
- XAG/USD eyeing key trendline, with oil watching 2019/20 peaks

Silver and gold prices started off the week on a pessimistic note, extending declines from Friday on a similar fundamental theme. That has been a combination of a rising US Dollar and longer-term Treasury yields, as expected. Rising rates of return in fixed-income assets can bode ill for non-yielding assets, such as silver and gold.
Meanwhile, crude oil prices experienced a volatile Monday. Energy prices started off with a burst of upside momentum after reports crossed the wires that a key storage tank in Saudi Arabia was attacked, creating supply woes. However, oil spent the rest of the day falling as it became clear that output would be unaffected.
The economic calendar docket is fairly light heading into the remaining 24 hours, especially in the United States. Oil may see some volatility around API estimates for weekly stockpiles. These will be compared to official DOE figures later in the week.
Market sentiment is looking upbeat, with most Asia-Pacific equities trading in the green on Tuesday as Treasury yields weaken. This is giving commodities some breathing space as traders await Wednesday’s US CPI data for further clues into where inflation is going. As such, silver and oil prices may consolidate ahead.

Silver Technical Analysis
Silver prices are attempting to find follow-through after XAG/USD broke under key rising support from March 2020 – see chart below. Immediately below is the 24.0632 – 24.8847 support zone, where the 200-day Simple Moving Average (SMA) is also waiting.
Silver Daily Chart
Chart Created Using TradingView
Crude Oil Technical Analysis
Crude oil prices are consolidating within the 64.05 – 66.58 resistance zone, composed of peaks achieved in 2019 and 2020. Negative RSI divergence is present, showing that upside momentum is fading. This can at times precede a turn lower, with immediate support below at 59.27.
WTI Crude Oil Daily Chart
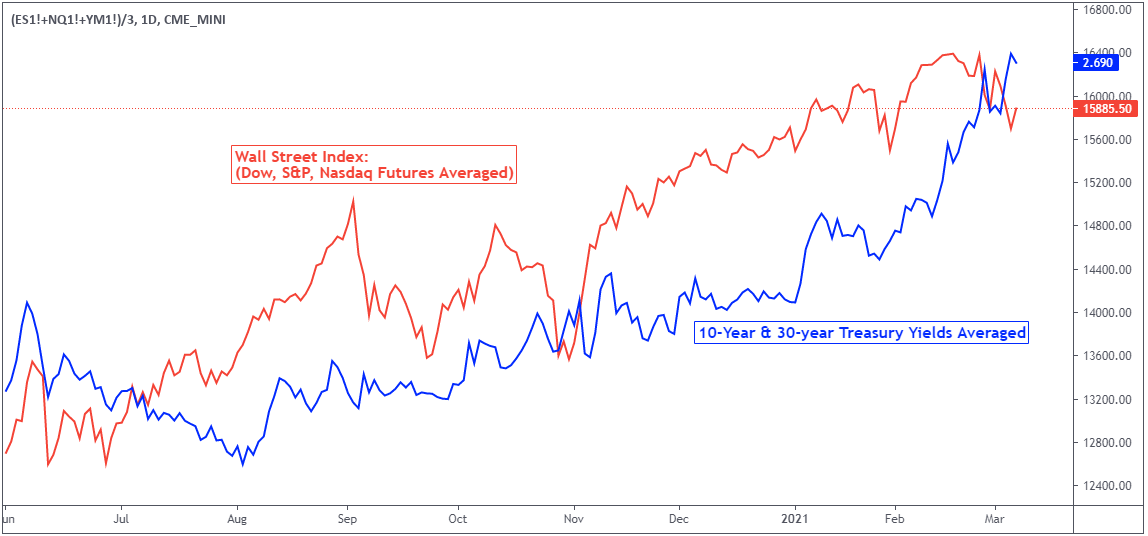
Chart Created Using TradingView
--- Written by Daniel Dubrovsky, Strategist for DailyFX.com
To contact Daniel, use the comments section below or @ddubrovskyFX on Twitter


