


CRUDE OIL & GOLD TALKING POINTS:
- Crude oil prices edge up with stock markets in risk-on trade
- Modest advance fails to disrupt cautiously bearish chart cues
- Gold prices soar to nine-year high as the US Dollar declines
Crude oil prices rose alongside stocks as a pickup in market-wide risk appetite buoyed cycle-sensitive assets. The upbeat mood likewise undermined haven demand for the US Dollar, which echoed as supportive for anti-fiat alternatives and pushed gold prices to their highest in nine years.
Sectoral performance for the bellwether S&P 500 index suggests that, in the absence of a decisive catalyst, the markets defaulted to the now-familiar pattern of ranking performance based on degree of Covid-19 disruption risk. Technology shares proved strongest while materials, energy and industrials suffered.
All eyes now turn to US jobless claims data. Initial applications for unemployment benefits are seen falling to the lowest level since mid-March, before the coronavirus outbreak triggered a sharp upward spike. The re-imposition of lockdowns in some parts of the US might make for disappointment however.

CRUDE OIL TECHNICAL ANALYSIS
Crude oil prices continue to mark time below resistance in the 42.40-43.88 area. The appearance of negative RSI divergence may prove to precede downturn, but confirmation is still pending. A daily close below 34.78 may expose the 27.40-29.11 area. Alternatively, a break of resistance likely eyes the $50/bbl figure next.
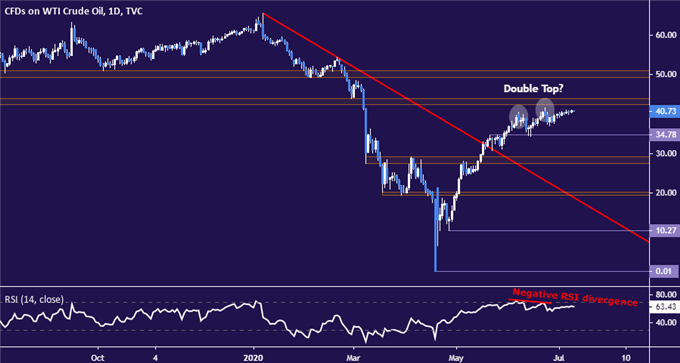
Crude oil price chart created using TradingView
GOLD TECHNICAL ANALYSIS
Gold prices are approaching resistance at 1827.82, the 50%Fibonacci expansion. A break above that on a daily closing basis may target the 61.8% level at 1864.86 next. The recently broken 38.2% expansionat 1789.78 has been recast as support, followed by a former range top at 1747.74.
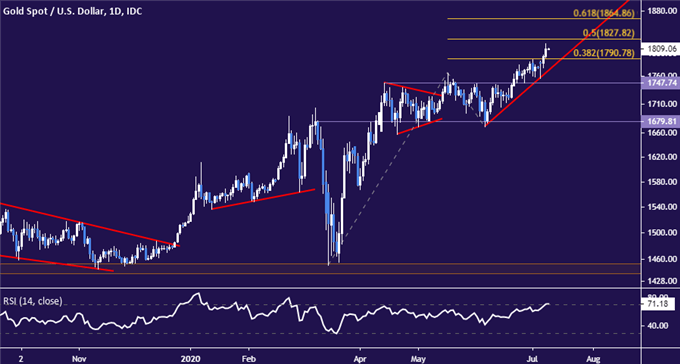
Gold price chart created using TradingView

COMMODITY TRADING RESOURCES
- See our free guide on the drivers of crude oil price trends
- What is your trading personality? Take our quiz to find out
- Join a free live webinar and have your questions answered
--- Written by Ilya Spivak, Head APAC Strategist for DailyFX
To contact Ilya, use the comments section below or @IlyaSpivak on Twitter


