


GOLD & CRUDE OIL TALKING POINTS:
- Gold prices rise to meet key chart resistance on dovish Fed comments
- Completing bullish Rising Wedge setup may mark uptrend resumption
- Crude oil prices seesaw on inventory data, IEA report in focus ahead
Gold prices pushed higher as dovish comments from Fed Chair Powell drove bond yields and the US Dollar lower. That understandably bolstered the appeal of non-interest-bearing and anti-fiat assets epitomized by the yellow metal. He said the central bank would need to see “significant and persistent” inflation rise to justify a rate hike even as additional easing appeared to be off the table through 2020.
Crude oil prices swing sharply lower as EIA inventory data showed stockpiles unexpectedly added 822k barrels last week. Economists were expecting a 2.9-million-barrel drawdown. The selloff proved to be short-lived however as traders rebalanced exposure ahead of the FOMC policy announcement. That news itself seemed to have limited impact, leaving the WTI contact little-changed on the day.
GOLD PRICES AWAIT UK ELECTION NEWS, CRUDE OIL EYES IEA REPORT
Looking ahead, gold may take on a digestive tone as sentiment trends idle while traders await clues on the outcome of the UK general election. Meanwhile, crude oil prices will look to the monthly IEA Oil Market Report for direction cues. An analogous document from OPEC published yesterday warned that a US-led swell in production will see supply growing at twice the pace of demand next year.
GOLD TECHNICAL ANALYSIS
Gold are poised to test resistance in the at the top of a bullish Falling Wedge pattern, now at 1487.85. Breaking above that would suggest uptrend resumption, initially targeting the 1516.05-23.05 congestion area. Support begins at 1453 and runs down through the Wedge floor, now at 1427.53.
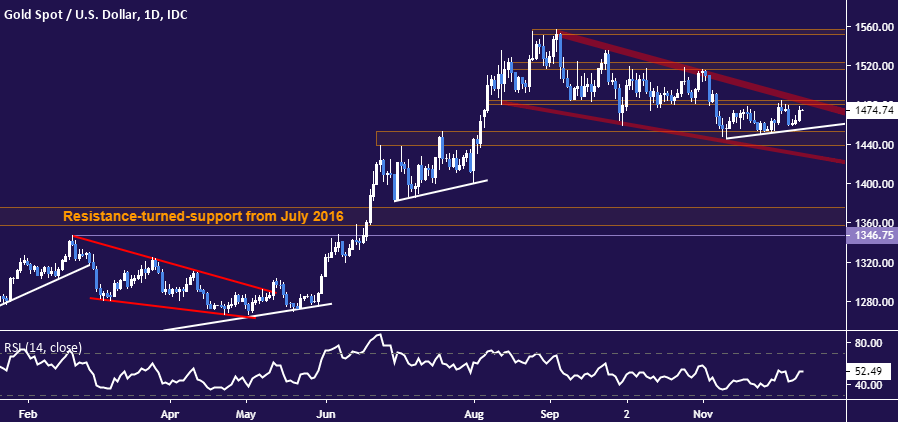
Gold price chart created using TradingView
CRUDE OIL TECHNICAL ANALYSIS
Crude oil prices are still pinned to resistance in the 60.04-84 area but negative RSI divergence hints that a downturn may be brewing. A daily close below rising channel support (now at 55.85) targets the long-standing range floor in the 50.52-51.00 zone next. A break above resistance aims for September’s high at 63.38.
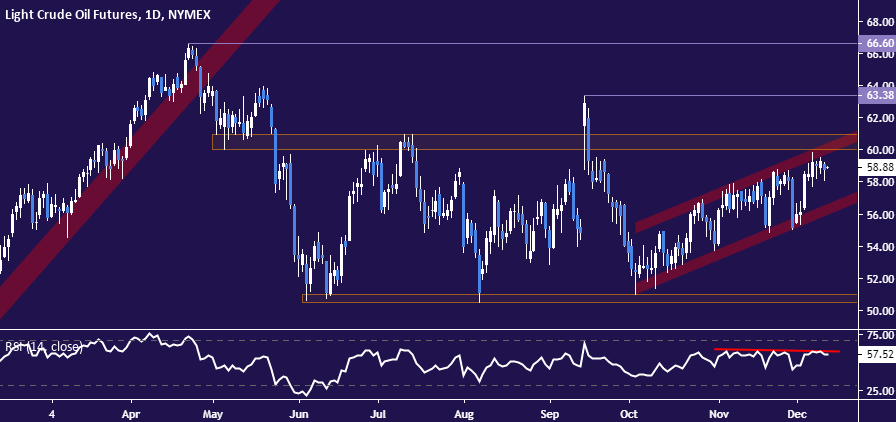
Crude oil price chart created using TradingView
COMMODITY TRADING RESOURCES
- See our guide to learn about the long-term forces driving crude oil prices
- Having trouble with your strategy? Here’s the #1 mistake that traders make
- Join a free webinar and have your commodity market questions answered
--- Written by Ilya Spivak, Currency Strategist for DailyFX.com
To contact Ilya, use the comments section below or @IlyaSpivak on Twitter


