


CRUDE OIL & GOLD TALKING POINTS:
- Crude oil prices sustain explosive weekly open surge, eyeing April high
- Gold price chart continues to warn that a near-term top is in the works
- Commodities may idle as markets await FOMC policy announcement
Crude oil prices swung lower intraday – retracing some of the dramatic upward gap registered at the start of the week after an attack on Saudi energy infrastructure – but the correction would not be sustained. The WTI contract returned to Monday’s trading open and then some, finishing the day with a formidable increase of nearly 15 percent.
That traders were not mollified by promises to make up lost capacity with ample Saudi and US reserves, compelling though they were. Indeed, worries about a supply glut dominated the conversation among market participants until this week. This might speak to fears not of the immediate impact of this disruption, but of whatever comes next if regional tensions truly boil over.
Under normal circumstances, the release of API inventory flow data might have been the focal point from here. The outcome will be weighed against forecasts calling for a 2.1-million-barrel drawdown. Its influence may be overshadowed however as traders continue to size up how long Saudi capacity will remain hamstrung. A press conference with recently-minted energy minister Abdulaziz bin Salman is due.
The proximity of the FOMC monetary policy announcement may likewise cool directional conviction, and not just for oil. Gold prices may likewise struggle for direction until Chair Powell and company have expounded on where they are steering delivering another widely-expected 25bps interest rate cut. Officials’ reluctance to pre-commit may cool dovish speculation, hurting the yellow metal and crude alike.
Get our free guide to help build confidence in your gold and crude oil trading strategy !
GOLD TECHNICAL ANALYSIS
Gold prices are showing the outlines of a bearish Head and Shoulders (H&S) top. Confirmation on a daily close below 1480.00 would imply a measured downside objective within a whisker of the $1400/oz figure, though interim support in the 1437.70-52.95 zone must be cleared along the way. Alternatively, a move back above 1523.05 puts the weekly chart inflection level at 1563.00 back in focus.
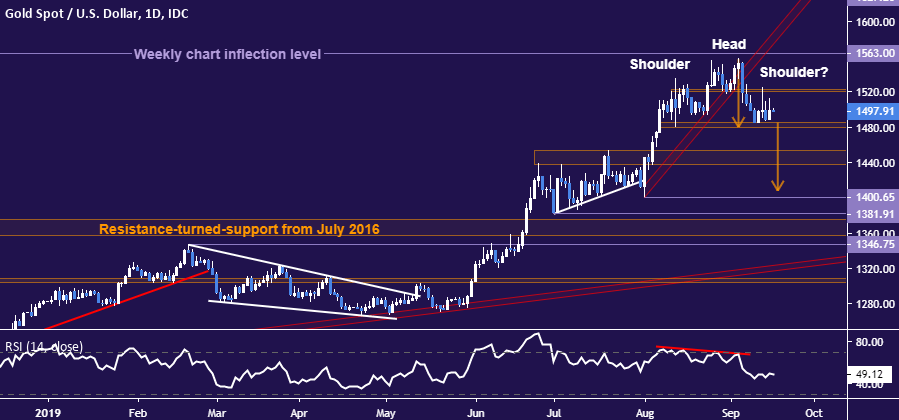
Gold price chart created using TradingView
CRUDE OIL TECHNICAL ANALYSIS
Crude oil prices appear to have confirmed the break of resistance near the $60/bbl figure on a daily closing basis. That puts the next upside barrier at 63.59-64.43 zone, with a further breach above that targeting April’s swing top. Closing back below 58.76 seems like a prerequisite to ponder downside follow-through.
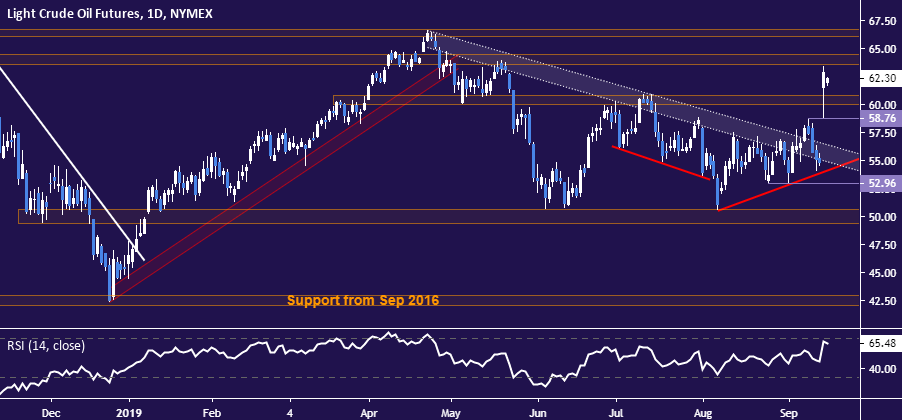
Crude oil price chart created using TradingView
COMMODITY TRADING RESOURCES
- See our guide to learn about the long-term forces driving crude oil prices
- Having trouble with your strategy? Here’s the #1 mistake that traders make
- Join a free webinar and have your commodity market questions answered
--- Written by Ilya Spivak, Currency Strategist for DailyFX.com
To contact Ilya, use the comments section below or @IlyaSpivak on Twitter


