


Talking Points:
- Crude oil prices struggle to find fuel to break range boundaries
- Gold prices may return to the offensive following a brief pause
- Haggling over US tax cut plan may inspire week-end volatility
Crude oil prices corrected gently higher but didn’t to make significant progress outside of recent ranges. Baker Hughes rig count data as well as ICE and CFTC speculative sentiment statistics are due out, but these are rarely market-moving. That makes continued consolidation likely into the week-end.
Gold prices paused to digest gains as expected following a sharp surge in the aftermath of the FOMC monetary policy announcement. A quiet data docket Friday hints the path of least resistance might favor the upside as “fade the Fed” dynamics re-emerge.
Politics may complicate things however as Congressional Republicans delay until Monday a tax cut plan reconciling proposals from the Senate and the House of Representatives. That’s after two senators planned to oppose it, with two more undecided. That’s two possibly lost votes too many to assure passage.
The absence of top-tier scheduled event risk might put the spotlight on Washington DC horse-trading. Headlines suggesting the voting math will work after all may stoke risk appetite, sending yields higher and hurting gold. A confirmed breakdown will probably produce the opposite result.
What are the long-term drivers of crude oil price trends? See our guide to find out!
GOLD TECHNICAL ANALYSIS – Gold prices continue to eye resistance at 1264.92, the 23.6% Fibonacci expansion, with a daily close above that targeting the 38.2% level at 1282.61. Alternatively, a turn below the 14.6% Fib expansion at 1241.36 exposes the December 12 low at 1236.32, followed by the 23.6% expansion at 1230.45.
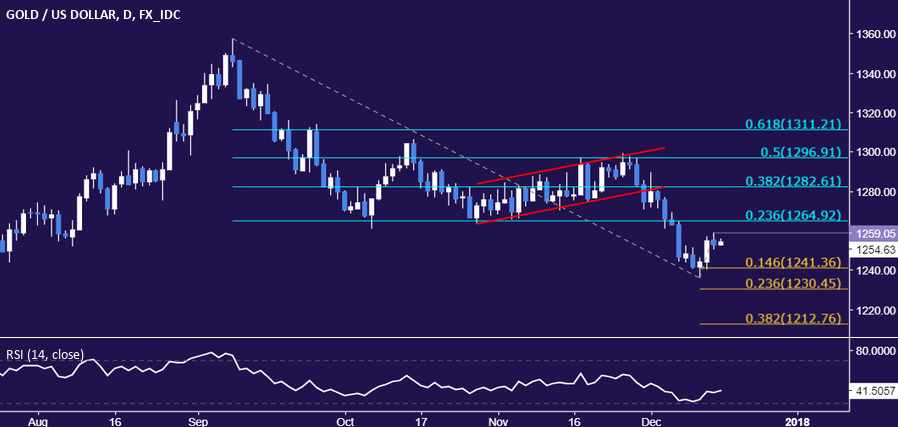
Chart created using TradingView
CRUDE OIL TECHNICAL ANALYSIS – Crude oil prices remain stuck in what is increasingly looking like a Triangle chart pattern. That setup typically precedes trend continuation, which is a bullish sign in this case. A daily close above the Triangle top (58.42) exposes the 23.6% Fibonacci expansion at 59.83. Alternatively, a push below the formation’s bottom (56.20) targets the 23.6% Fib retracement at 55.04.
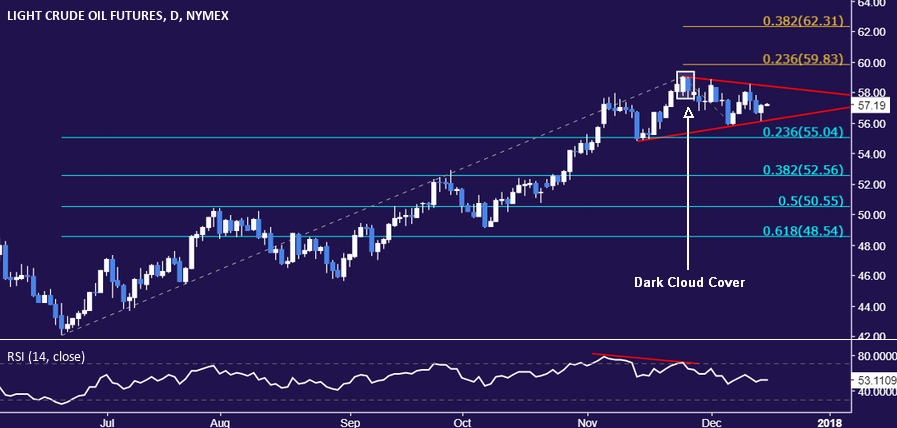
Chart created using TradingView
--- Written by Ilya Spivak, Currency Strategist for DailyFX.com
To receive Ilya's analysis directly via email, please SIGN UP HERE
Contact and follow Ilya on Twitter: @IlyaSpivak


