


Talking Points:
- Commodities mark time as all eyes turn to Jackson Hole symposium
- Gold prices may fall if Fed’s Yellen hints QT to begin in September
- Crude oil prices vulnerable if hawkish Fed stance boosts US Dollar
Commodity prices remain locked in familiar ranges as financial markets await direction cues from the Fed’s annual policy symposium underway in Jackson Hole, Wyoming. A much-anticipated speech from Chair Janet Yellen takes top billing.
Traders are looking for comments signaling the imminent start so-called “quantitative tightening” (QT) – the unwinding of the US central bank’s bloated post-crisis balance sheet – as well as rhetoric shaping the probability of another rate hike before the end of the year.
Minutes from July’s FOMC meeting revealed that policymakersexpect to begin balance sheet reduction at “an upcoming meeting”. If Yellen appears to signal this will happen in September, that will leave room for a hike in December, assuming the “idiosyncratic” forces holding down inflation fade as expected.
Gold prices are likely to suffer in this scenario as the prospect of higher rates undermines the appeal of non-interest-bearing assets. Crude oil prices may likewise suffer as bets on a steeper tightening cycle boost the US Dollar, applying de-facto pressure to assets denominated in terms of the greenback.
What is the #1 mistake that traders make, and how can you fix it? Find out here !
GOLD TECHNICAL ANALYSIS – Gold prices remain locked in a narrow band below resistance in the 1295.46-1300.46 area (double top, 38.2% Fibonacci expansion). From here, a daily close below the 1284.75-78.22 area (23.6% Fib retracement, trend line) targets the 38.2% level at 1264.23. Alternatively, a breach of resistance exposes the 50% expansion at 1310.74.
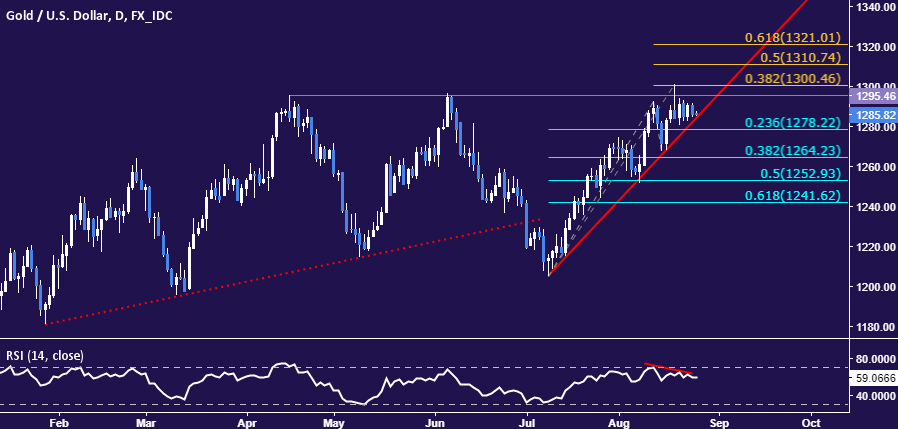
Chart created using TradingView
CRUDE OIL TECHNICAL ANALYSIS – Crude oil prices continue to mark time in a now-familiar range above the $46/barrel figure. A daily close below the 38.2% Fibonacci expansion at 46.62 exposes the 50% level at 45.46. Alternatively, a push above 48.76 (former support shelf, trend line) opens the door for a retest of the August 1 high at 50.40.

Chart created using TradingView
--- Written by Ilya Spivak, Currency Strategist for DailyFX.com
To receive Ilya's analysis directly via email, please SIGN UP HERE
Contact and follow Ilya on Twitter: @IlyaSpivak


