
Japanese Yen, USD/JPY, Fed, Treasury Yields, Crude Oil, WTI - Talking Points
- USD/JPY makes a new high as yields explode across G-10 curves
- Higher energy costs emerge after OPEC+ maintain production goals
- Bullish USD/JPY momentum is unfolding, will it continue to set-up a trend?

The Japanese Yen is coming under pressure from rising G-10 yields, higher energy costs and positive risk appetite to begin the year. This led to USD/JPY making a 4-year high of 116.35 yesterday.
The market has started 2022 by re-pricing the Federal Reserve’s hiking timeline and it is now anticipating more rate rises than previously expected.
US Treasury yields have risen significantly across the curve, with the benchmark 10-year bond recently trading above 1.68%, after finishing 2021 near 1.50%.
Japanese investors are highly cognisant of yield after experiencing decades of near zero interest rate returns. While Japanese government bonds (JGBs) have seen an uptick of a couple of basis points, the rest of the G-10 government bond curves are notably higher.
OPEC+ met last night and agreed to stick to the current path of returning production that had been withdrawn in the aftermath of the outbreak of Covid-19. Their analysts now see a daily surplus of 1.4 million barrels a day for the first quarter, against the previous estimate of 1.9 million barrels.
Crude oil went higher as a result, with the WTI futures contract making a high of USD 77.64 a barrel. Japan relies on importing energy commodities to fuel their economy.
The positive outlook has seen risk assets appreciate so far this week, with most equity markets beginning 2022 in the green.
Notable exceptions were the Nasdaq, which is susceptible to higher yields, and Chinese indices that were weighed down by domestic factors.
Looking ahead, the Fed’s meeting minutes from their last get together will be released later today and Tokyo CPI for December is due for release tomorrow.
Introduction to Technical Analysis
Learn Technical Analysis
Recommended by Daniel McCarthy
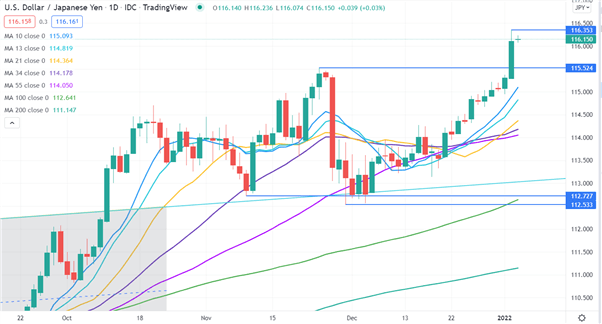
USD/JPY – Technical Analysis
A bullish triple moving average (TMA) formation requires the price to be above the short term simple moving average (SMA), the latter to be above the medium term SMA and the medium term SMA to be above the long term SMA. All SMAs also need to have a positive gradient.
Looking at any three of the 10, 13, 21, 34, 55, 100 and 200-day SMAs, the criteria for a bullish TMA have been met.
Resistance could be at the recent high of 116.353 while support might be at the pivot points of 115.524 and 112.727. The recent low of 112.533 may also provide support.
Introduction to Technical Analysis
Moving Averages
Recommended by Daniel McCarthy
--- Written by Daniel McCarthy, Strategist for DailyFX.com
To contact Daniel, use the comments section below or @DanMcCathyFX on Twitter