
US Recession Watch Overview:
- There is less than a 30% chance of a recession hitting the United States within the next 12-months, according to the NY Fed Recession Probability Indicator. The 3m10s spread is currently 12-bps; onthe last day of September it was -14-bps.
- Risk appetite continues to build among traders, with the US Treasury yield curve continuing to undergo bearish steepening in recent weeks.
- Amid decling US recession odds, market participants no longer see a rate cut from the Federal Reserve in December 2019; the timing of the next cut has been pushed back to June 2020.
See the DailyFX Economic Calendar and see what live coverage for key event risk impacting FX markets is scheduled for next week on the DailyFX Webinar Calendar.
In the prior entry in the US Recession Watch series, we concluded that “given that data had performed better than expected and growth expectations failed to rise meaningfully suggests that market participants had been far too bearish on the US economy in the short-term.” A look at price action over recent weeks suggests that many of the concerns from the summer months have evaporated. With a potential US-China trade deal appeared on the horizon, traders were keen to jettison safe haven assets like the Japanese Yen and US Treasuries (pushing yields higher – more on that below) and bid up higher risk assets like equities.
US Economic Data Weaker, Growth Expectations Stumble
During October, US economic data deteriorated relative to analysts’ expectations. The Citi Economic Surprise Index for the US has fell from 43 at the end of September to 4.7 by the end of October. Given that data had underperformed and growth expectations have struggled suggests that fears of a US and a global recession linger – even if those odds have seemingly dropped.
Atlanta Fed GDPNow Q4’19 US GDP Estimate (November 6, 2019) (Chart 1)
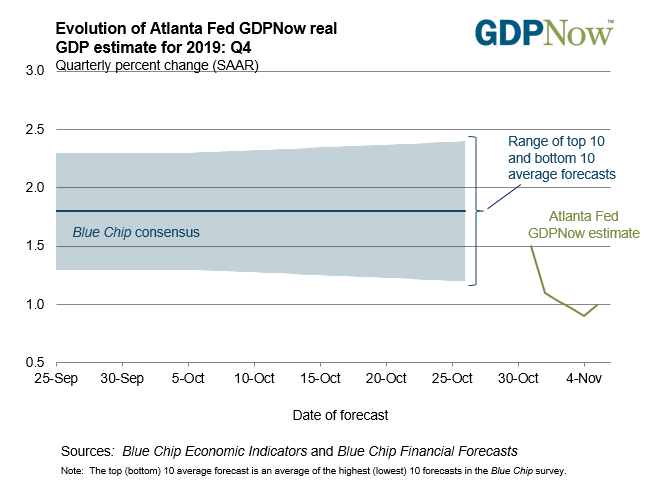
Amid otherwise disappointing US economic data momentum, US growth expectations have struggled in recent weeks. Based on the data received thus far about Q4’19, the Atlanta Fed GDPNow forecast is looking for growth at 1.0%. Q4’19 US GDP expectations have ranged between 0.9-1.5% since tracking began at the end of October. The next update to the Q4’19 forecast will be released after the October US wholesale trade data due on November 8.
Fed Rate Cut Expectations Less Dovish
According to Fed funds futures, there is a 12% chance of a 25-bps rate cut at the December Fed meeting (or an 88% chance of no change in interest rates). Low rate cut odds are not a surprise following Fed Chair Jerome Powell’s remarks at the October Fed meeting where he all but closed off the path to any further rate moves. As a result, there is no greater than a 48% chance of a rate move in either direction over the next six months.
Federal Reserve Interest Rate Expectations (November 6, 2019) (Table 1)

There has been a cleartrajectory for a less dovish Fed in recent weeks one month ago on October 7, there was a 39% chance of the main rate dropping to 1.25-1.50% at the December Fed meeting. At the end of last week, the next rate cut was priced-in for March 2020; now, markets are favoring June 2020.
Using the US Yield Curve Inversion to Predict Recessions
The US Treasury yield curve has been moving away from inversion territory for several weeks – in fact, throughout October. Much of this was driven by the notion that the US-China trade war would be coming to an end, and as a result, global growth concerns would dissipate. The relatively faster rise by long-end yields compared to short-end yields may be seen as a sign that market participants don’t believe that the US will fall into recession soon; long-end yields are viewed as a proxy for growth and inflation expectations.
US Treasury Yield Curve (November 6, 2019) (Chart 2)
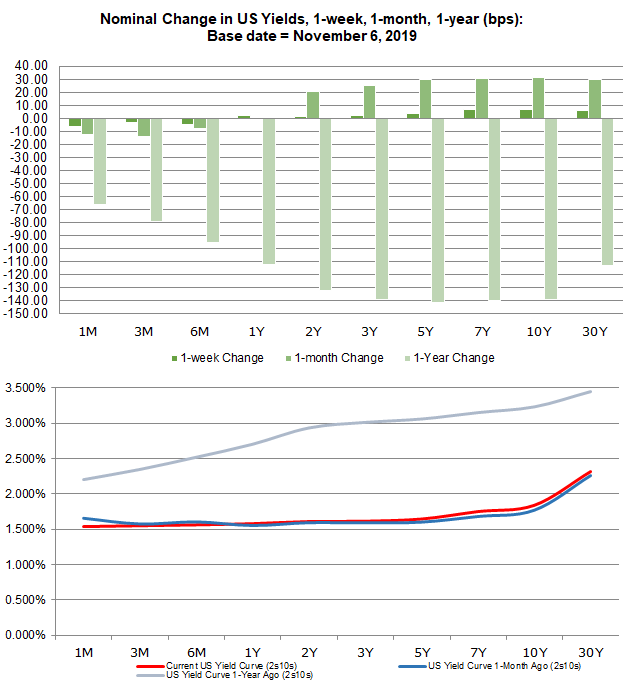
The bearish steepening of the US Treasury yield curve – short-end yields are rising slower than long-end yields – has proven to be a bellwether of improved sentiment among market participants. The steepening yield curve is typically a positive development for risk appetite. As the US Treasury yield curve steepened last month (the 3m10s spread moved from -11.4-bps to 18-bps in October), the US S&P 500 added 1.84%.
A Refresher: Why Does the US Yield Curve Inversion Matter?
The yield curve, if it’s based on AA-rated corporate bonds, German Bunds, or US Treasuries, is a reflection of the relationship between risk and time for debt at various maturities. A “normal” yield curve is one in which shorter-term debt instruments have a lower yield than longer-term debt instruments. Why? Put simply, it’s more difficult to predict events the further out into the future you go; investors need to be compenstated for this additional risk with higher yields. This relationship produces a positive sloping yield curve.
When looking at a government bond yield curve (like Bunds or Treasuries), various assessments about the state of the economy can be made at any point in time. Are short-end rates rising rapidly? This could mean that the Fed is signaling a rate hike is coming soon. Or, that there are funding concerns for the federal government. Have long-end rates dropped sharply? This could mean that growth expectations are falling. Or, it could mean that sovereign credit risk is receding. Context obviously matters.
US Treasury Yield Curves: 3m10s and 2s10s (1975 to 2019) (Chart 3)

Duke University finance professor Campbell Harvey, whose 1986 dissertation explored the concept of using the yield curve to forecast recessions, has said that the yield curve needs to invert in the 3m10s for at least one full quarter (or three months) in order to give a true predictive signal (since the 1960s, a full quarter of inversion has predicted every recession correctly).
NY Fed Recession Probability Indicator (November 6, 2019) (Chart 4)

As the 3m10s spread moved out of inversion territory in October, the market-derived probability of a US recession fell between recession watch updates..Using the 3m10s spread, the NY Fed Recession Probability Indicator is now suggesting a 29% chance of a recession hitting the US economy within the next 12-months – down from the 35% chance seen at the start of October.
Conclusions about US Yield Curve Inversion and US Recession Odds
The last time the NY Fed recession probability indicator was updated was on November 4. At that time, the 3m10s spread was 27.2-bps; onthe last day of October it was 18-bps; and on the last day of September it was -11.4-bps.Currently, the 3m10s spread is no longer inverted, trading at 31.6-bps.
The last time the 3m10s spread was at least 31.6-bps was during the first week of March 2019. Accordingly, backing out this assumption, the NY Fed Recession Probability Indicator would be discounting around a 15% chance of a recession hitting the US economy in the next 12-months if the indicator were updated in real-time.
FX TRADING RESOURCES
Whether you are a new or experienced trader, DailyFX has multiple resources available to help you: an indicator for monitoring trader sentiment; quarterly trading forecasts; analytical and educational webinars held daily; trading guides to help you improve trading performance, and even one for those who are new to FX trading.
--- Written by Christopher Vecchio, CFA, Senior Currency Strategist
To contact Christopher Vecchio, e-mail at cvecchio@dailyfx.com
Follow him on Twitter at @CVecchioFX
View our long-term forecasts with the DailyFX Trading Guides