


US Recession Watch Overview:
- There is a 35% chance of a recession hitting the United States within the next 12-months, according to the NY Fed Recession Probability Indicator. The 3m10s spread is currently 12-bps; onthe last day of September it was -14-bps.
- The bearish steepening of the US Treasury yield curve – long-end rates are rising faster than short-end rates – is a sign of improving risk appetite among traders.
- As US recession fears abate thanks to signs of the US-China trade war de-escalating, rates markets are no longer pricing in three 25-bps rate cuts from the Federal Reserve by September 2020.
See the DailyFX Economic Calendar and see what live coverage for key event risk impacting FX markets is scheduled for next week on the DailyFX Webinar Calendar.
In the prior entry in the US Recession Watch series, we concluded that “the start of September offers a chance for traders to reassess the US economy and the perceived threat of growing recession odds.” Indeed, the return of volumes to financial markets after the summer gave traders an earnest opportunity to reassess their prior held beliefs regarding the state of the global economy – particularly as a potential US-China trade deal appeared on the horizon.
US Economic Data Better, but Growth Expectations Still Lag
Over the course of September, US economic data has improved relative to analysts’ expectations. The Citi Economic Surprise Index for the US has improved from -11 at the end of August to 43 by the end of September. Like during August, given that data had performed better than expected and growth expectations failed to rise meaningfully suggests that market participants had been far too bearish on the US economy in the short-term. It still holds that fears of a US and a global recession linger.
Atlanta Fed GDPNow Q4’19 US GDP Estimate (October 18, 2019) (Chart 1)
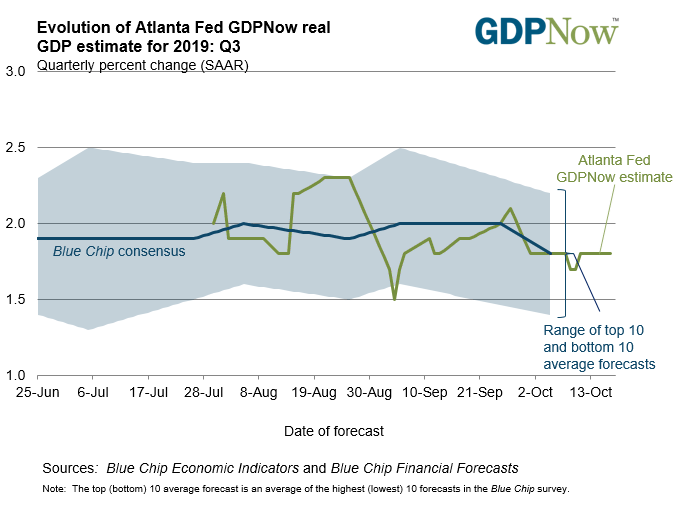
US growth expectations have moved sideways despite economic data improving relative to analysts’ expectations in recent weeks. Based on the data received thus far about Q4’19, the Atlanta Fed GDPNow forecast is looking for growth at 1.8%. Q4’19 US GDP expectations have ranged between 1.5-2.3% since tracking began at the end of July. The next update to the Q4’19 forecast will be released on Thursday, October 24.
Fed Rate Cut Expectations Less Dovish
There is now a 72% chance of a 25-bps interest rate cut at the October Fed meeting, according to Fed funds futures (or a 28% chance of no change in interest rates). If not, there is an 82% chance of the rate cut coming at the December Fed meeting. But if the Fed does indeed cut rates in October, then rates markets are pricing in only a 25% chance of another 25-bps rate cut by the end of the year.
Federal Reserve Interest Rate Expectations (October 15, 2019) (Table 1)
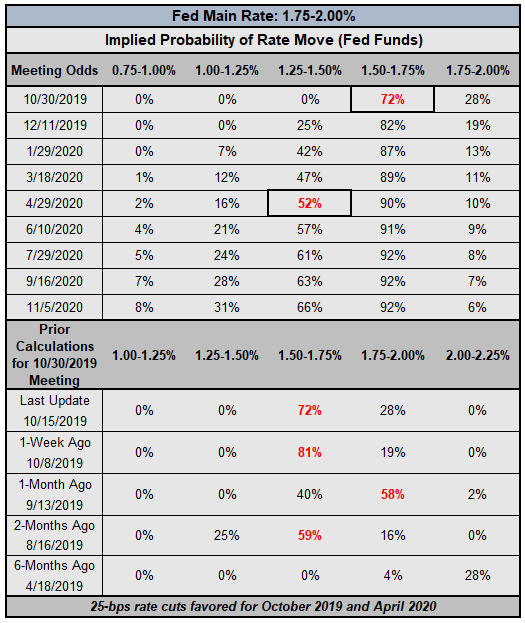
Coming into this week, there was a 71% chance of a 25-bps rate cut at the October Fed meeting; one week ago, those odds were 81%. While the trajectory has been for a less dovish Fed in recent days, it is worth noting that one month ago, there was a 58% chance of no change in interest rates at the October Fed meeting.
Last week, three rate cuts were priced-in through September 2020, for October and December 2019 and April 2020; now, only two rate cuts are discounted, expected in October 2019 and March 2020.
Using the US Yield Curve Inversion to Predict Recessions
Now that the US Treasury yield curve is no longer inverted (more on that shortly), movements in the short-term indicate a bump in sentiment among traders. The relatively faster rise by long-end yields compared to short-end yields in recent days reinforces the idea that the global growth is not at as significant of a risk as previously thought, and the US may not dip into recession right away; long-end yields are seen as a proxy for growth and inflation.
US Treasury Yield Curve (October 15, 2019) (Chart 2)
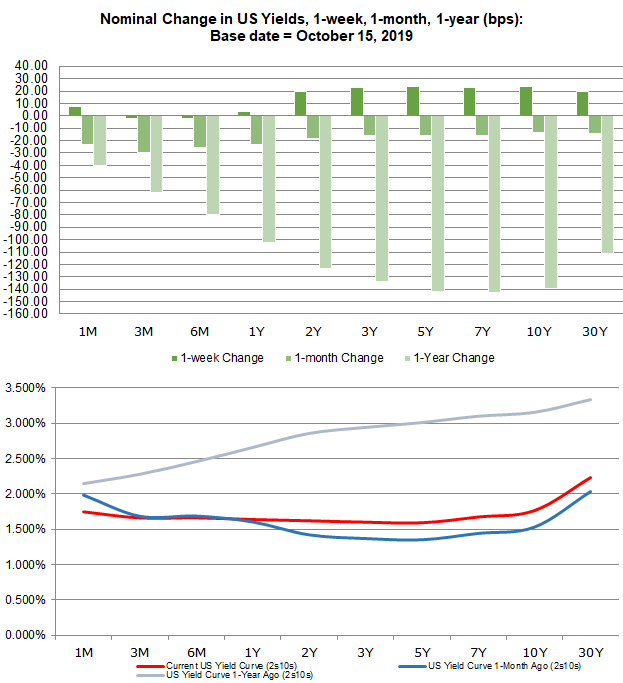
The bearish steepening of the US Treasury yield curve – long-end rates are rising faster than short-end rates – is proving to be a bellwether of improved sentiment among market participants. The steepening yield curve is typically a positive development for risk tolerance, and indeed, market participants are bidding up equities and selling off safe havens like gold.
A Refresher: Why Does the US Yield Curve Inversion Matter?
The yield curve, if it’s based on AA-rated corporate bonds, German Bunds, or US Treasuries, is a reflection of the relationship between risk and time for debt at various maturities. A “normal” yield curve is one in which shorter-term debt instruments have a lower yield than longer-term debt instruments. Why? Put simply, it’s more difficult to predict events the further out into the future you go; investors need to be compenstated for this additional risk with higher yields. This relationship produces a positive sloping yield curve.
When looking at a government bond yield curve (like Bunds or Treasuries), various assessments about the state of the economy can be made at any point in time. Are short-end rates rising rapidly? This could mean that the Fed is signaling a rate hike is coming soon. Or, that there are funding concerns for the federal government. Have long-end rates dropped sharply? This could mean that growth expectations are falling. Or, it could mean that sovereign credit risk is receding. Context obviously matters.
US Treasury Yield Curves: 3m10s and 2s10s (1975 to 2019) (Chart 3)
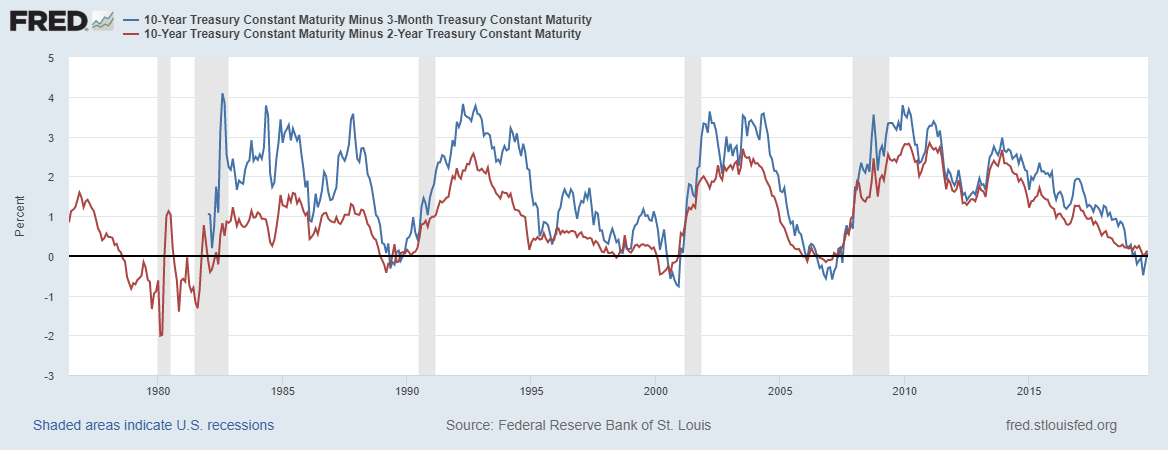
Duke University finance professor Campbell Harvey, whose 1986 dissertation explored the concept of using the yield curve to forecast recessions, has said that the yield curve needs to invert in the 3m10s for at least one full quarter (or three months) in order to give a true predictive signal (since the 1960s, a full quarter of inversion has predicted every recession correctly).
NY Fed Recession Probability Indicator (October 15, 2019) (Chart 4)
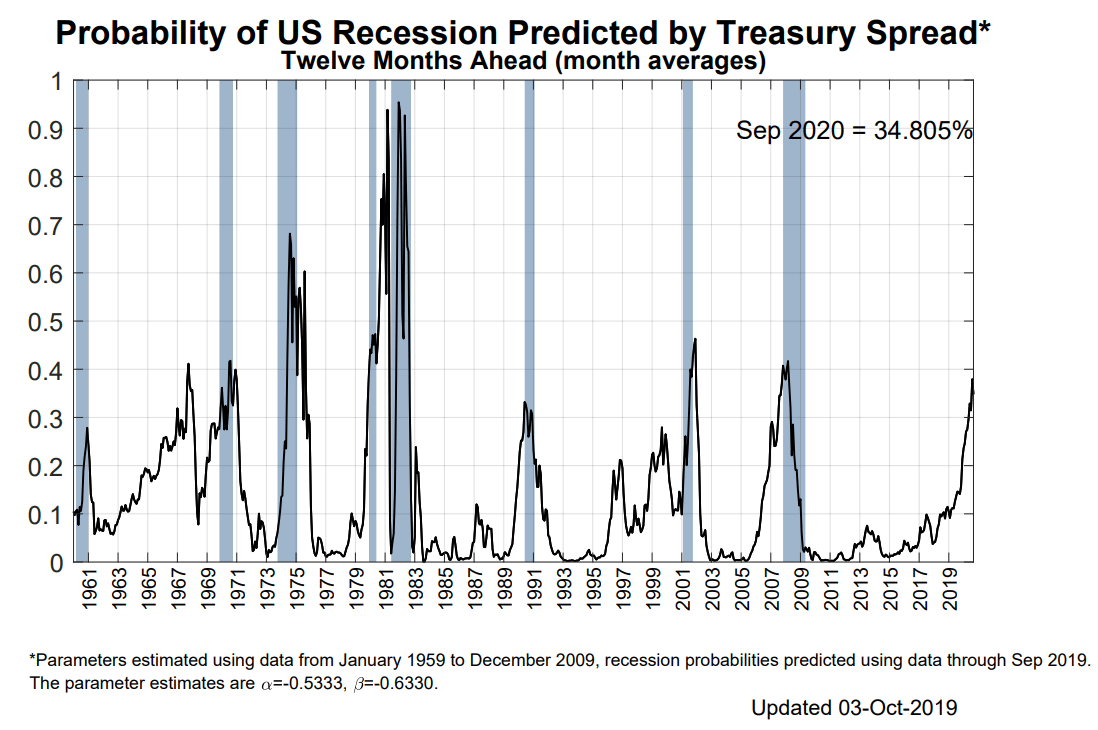
With the 3m10s spread inverted and staying inverted for three months through the end of September, but no deepening of inversion occuring, the probability of a US recession did not rise signficantly in between recession watch updates..Using the 3m10s spread, the NY Fed Recession Probability Indicator is now suggesting a 35% chance of a recession hitting the US economy within the next 12-months – down slightly from the 38% chance seen at the start of September.
Conclusions about US Yield Curve Inversion and US Recession Odds
The last time the NY Fed recession probability indicator was updated was on October 3. At that time, the 3m10s spread was -14-bps; onthe last day of August it was -45-bps; and on the last day of July it was -0.4-bps.Currently, the 3m10s spread is no longer inverted, trading at 12-bps.
The last time the 3m10s spread was at least 12-bps was at the start of May. Accordingly, backing out this assumption, the NY Fed Recession Probability Indicator would be discounting around a 20% chance of a recession hitting the US economy in the next 12-months if the indicator were updated in real-time.
FX TRADING RESOURCES
Whether you are a new or experienced trader, DailyFX has multiple resources available to help you: an indicator for monitoring trader sentiment; quarterly trading forecasts; analytical and educational webinars held daily; trading guides to help you improve trading performance, and even one for those who are new to FX trading.
--- Written by Christopher Vecchio, CFA, Senior Currency Strategist
To contact Christopher Vecchio, e-mail at cvecchio@dailyfx.com
Follow him on Twitter at @CVecchioFX
View our long-term forecasts with the DailyFX Trading Guides


