


US Dollar Talking Points:
- The US Dollar shot-higher on Friday on the back of a blowout NFP report, with price action returning to a key resistance zone that’s thus far held into this week.
- This week’s economic docket is rather busy with some key US drivers with Wednesday of particular interest as CPI is released in the morning with the FOMC’s final rate decision of 2019 taking place later in the day.
- There are a series of interesting setups on either side of the US Dollar, with this article looking into Gold for USD-weakness strategies to go along with USD/JPY for strategies of USD-strength.

US Dollar Returns to Resistance Ahead of December FOMC
The year is now winding down, and this week is a major focal point ahead of the end of the year as Central Bank rate decisions take place out of the Federal Reserve, the European Central Bank and the Swiss National Bank this week. Also of interest are US data releases on Wednesday morning for November CPI numbers and the Friday release of Advance Retail Sales, helping to keep the US Dollar in focus after what’s become a busy fourth quarter of the year.
October brought a change-of-pace, as 2019 had seen a strong USD despite the fact that the Fed stopped hiking rates and started to cut. Ahead of the Q4 open the FOMC had already cut twice, with a third on the way in late-October; but the US Dollar remained stubbornly strong ahead of the October open. But that was right around the time that sellers came back into the equation, pushing USD price action through the bottom of a rising wedge formation. A late-October pullback saw prices rise to a resistance zone that runs from 97.71 up to 97.86, with the FOMC rate decision bringing sellers back into the mix as prices pushed right back down to October support.
US Dollar Daily Price Chart
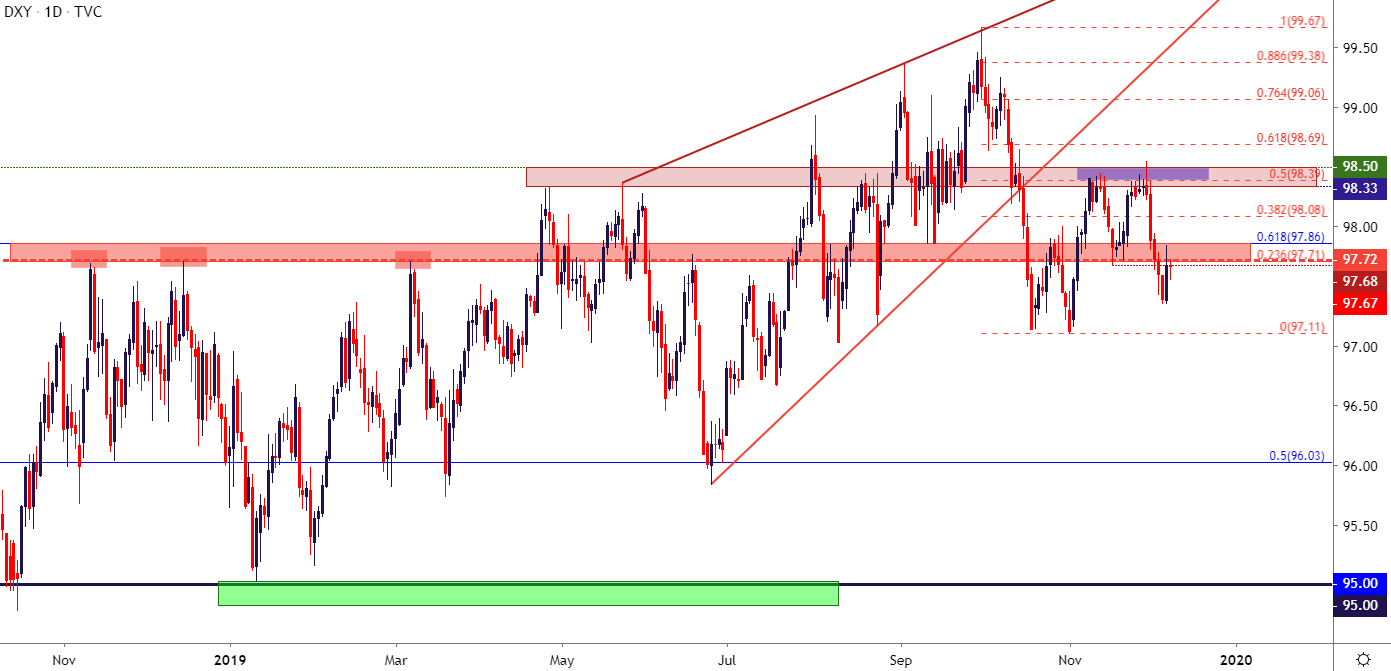
Chart prepared by James Stanley; US Dollar on Tradingview
November brought a calm in that theme of USD-weakness as prices retraced approximately 50% of that October sell-off, once again finding resistance at a prior zone of interest that runs from 98.33-98.50. Short-term support played in around that late-October resistance zone before buyers posed another test at 98.33-98.50 which similarly fell flat before sellers came back into the equation as December saw a return of the theme of short-term weakness in the USD.
Last Friday brought pullback in that theme around a really strong NFP report, helping prices to push back-up to find resistance in a familiar area, running from 97.70 up to 97.86. The latter of those prices is particularly compelling as this is very near the same level that marked the highs in DXY in November and December of last year; and again in March and June of this year.
US Dollar Eight-Hour Price Chart
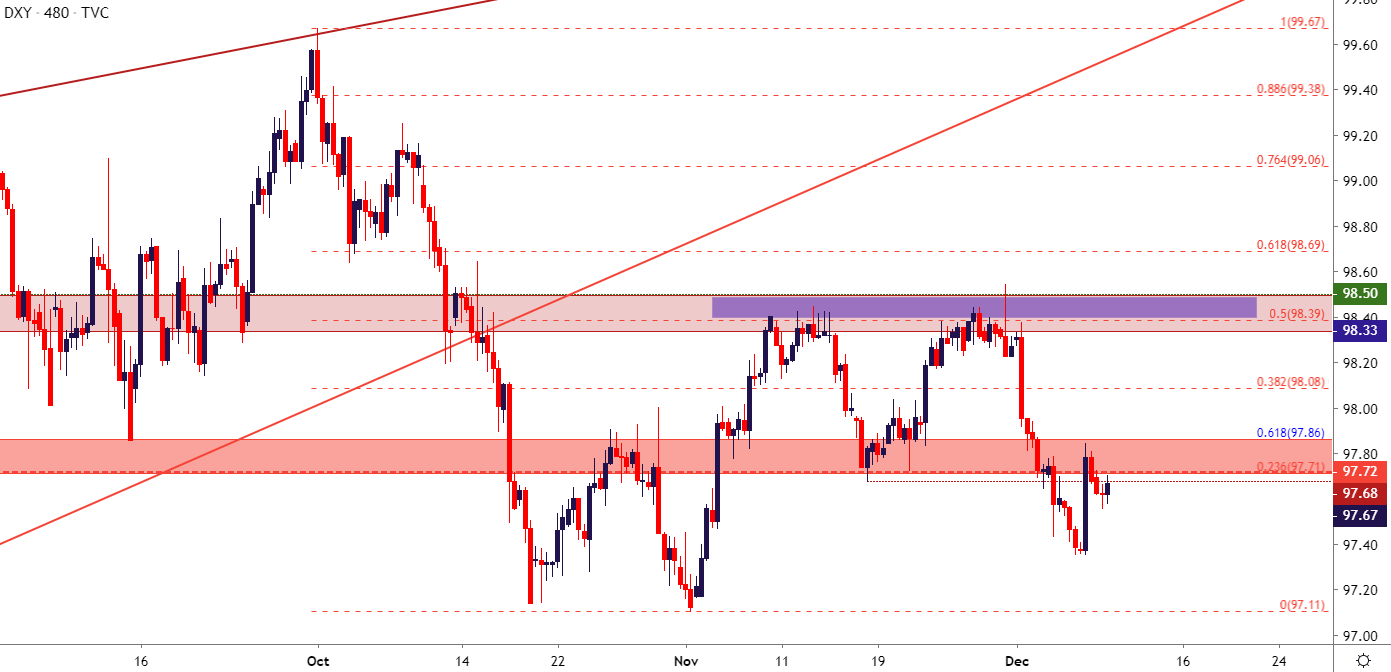
Chart prepared by James Stanley; US Dollar on Tradingview
FOMC Expected to Hold – But What Might They Say About Future Conditions?
There’s little expectation at this point for any actual rate moves out of the FOMC at Wednesday’s rate decision. The key here will likely be the details with which that no-move decision is rolled out and how exactly Powell addresses near-term rate policy during the accompanying press conference. This is a quarterly meeting, however, meaning that we’ll get updated rate projections via the dot plot matrix, and that can provide some workable themes in USD and related markets.
If USD-weakness shows in the wake of this week’s rate decision, Gold could be a compelling market to follow. As the Fed was backing down from rate hikes earlier this year, Gold prices benefitted massively as Gold prices broke out from below 1280 in early-June to above 1550 in early-September. As discussed earlier this morning, that bullish theme in Gold prices has been on hold over the past three months as price action has continued to digest prior gains; but has so far done so while remaining supported above the 38.2% Fibonacci retracement of that move, thereby keeping the door open for bullish continuation scenarios.
Gold Daily Price Chart
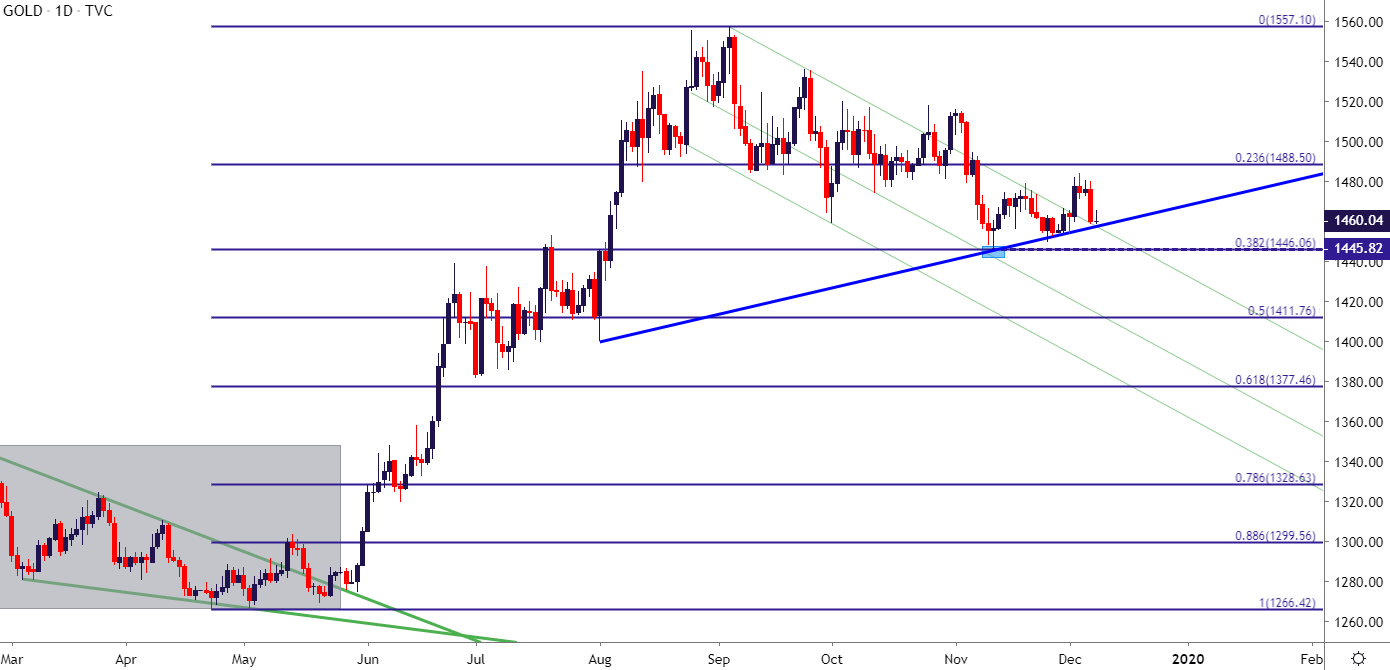
Chart prepared by James Stanley; Gold on Tradingview
If USD-strength is the net result from this week’s US drivers, USD/JPY can remain compelling amongst a few interesting options. USD/JPY is holding support at a key zone on the chart, as the 108.47 level has already elicited a number of interesting inflections over the past few months, most notably as a double top in September before showing up as support in mid-November, and continuing to hold through the early-portion of the final month of this year.
USD/JPY Eight-Hour Price Chart
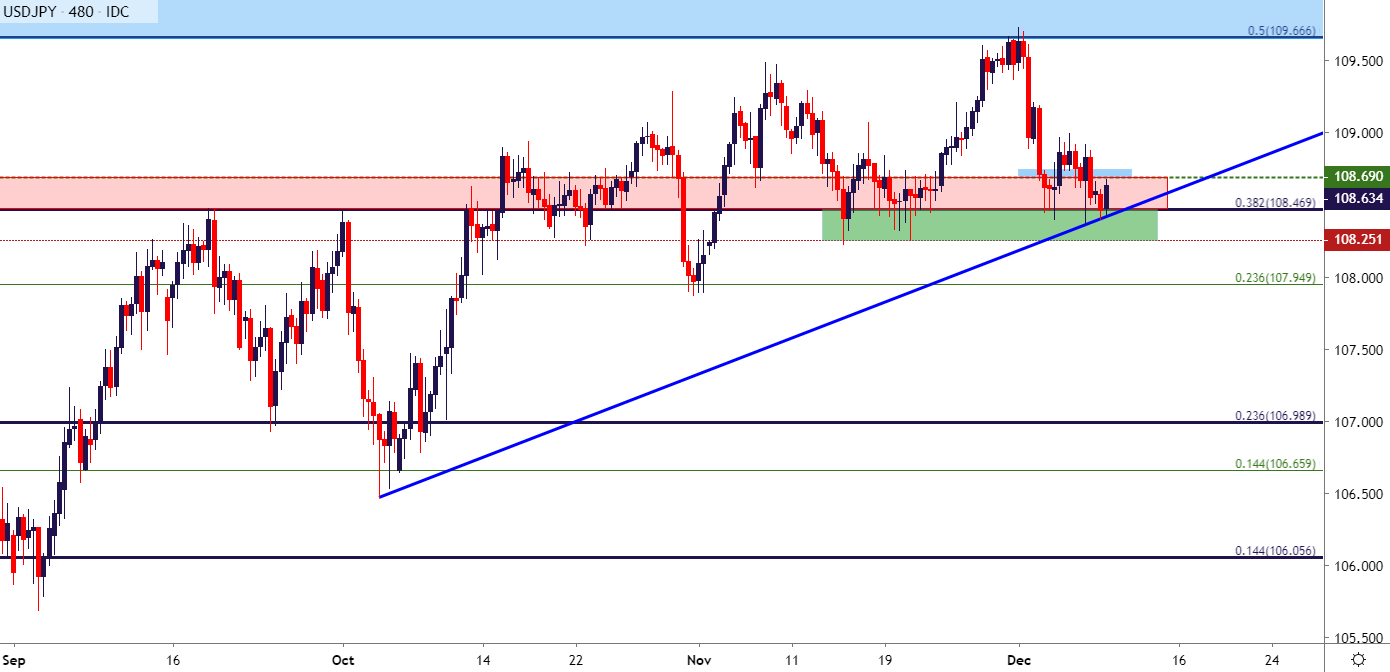
Chart prepared by James Stanley; USDJPY on Tradingview
--- Written by James Stanley, Strategist for DailyFX.com
Contact and follow James on Twitter: @JStanleyFX


