


WTI Crude Oil Talking Points:
- Crude oil price action continues to show elements of digestion after the early-October test of support in the key zone running from 50.54-51.70.
- The more enticing side of crude oil prices appears to be on the downside. But, are bears yet willing to pose a break? If the 50-level can get taken-out, a bigger area of support lurks below around the 42-handle which currently marks the three-year-lows.
- DailyFX Forecasts are published on a variety of markets such as Gold, the US Dollar or the Euro and are available from the DailyFX Trading Guides page. If you’re looking to improve your trading approach, check out Traits of Successful Traders. And if you’re looking for an introductory primer to the Forex market, check out our New to FX Guide.
WTI Crude Oil Price Digestion After Early-Month Support Inflection
Oil prices continue to show elements of digestion after the early-month assault on a key zone of support that shows just above the 50-handle. The price zone that runs from 50.54 up to 51.70 has now seen three separate tests over the past four months; each of which has failed as multiple bearish themes have run into a brick wall. As looked at last week, bearish strategies remained in order upon revisits to the near-term resistance zone that runs from 54.46-55.00 and that came into play around last week’s close and this week’s open. Sellers showed response to push prices back down but buyers stepped-in before another visit to the 50.57-51.70 zone could come into play.
WTI Crude Oil Eight-Hour Price Chart
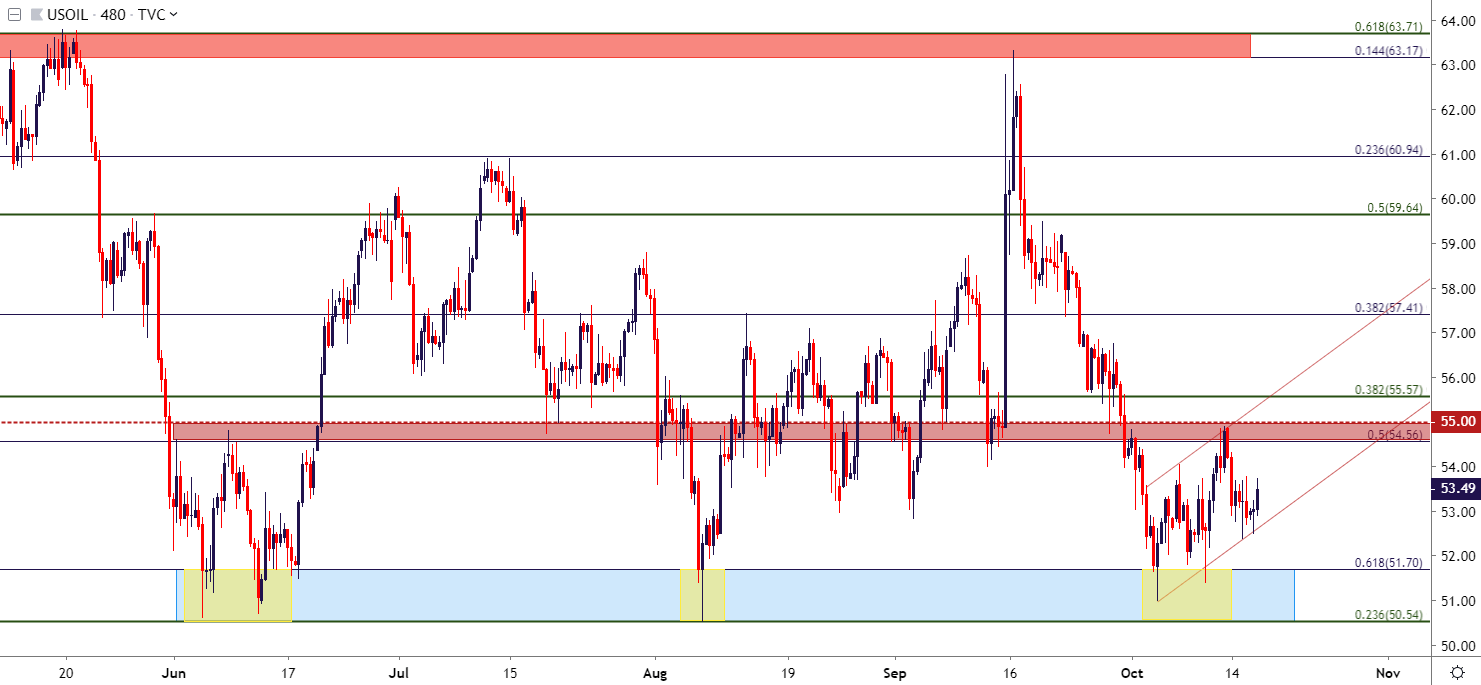
Chart prepared by James Stanley; Crude Oil on Tradingview
Crude Oil Support: Fourth Time the Charm?
As looked at last week, the bigger picture approach on WTI will likely remain as more attractive to the short side, and there’s two parts to this saga. The support looked at above that’s held the lows over the past four months remains of interest for bearish breakout strategies, but perhaps more importantly on the longer-term look is the area around three-year-lows that helped to arrest the 2018 Q4 decline. That comes in around the 42.00-level and, similarly, has held three different tests in late-2016, 2017 and again in December of last year.
A break through the nearby zone around 50 opens the door for a revisit to the longer-term zone around 42. The big question at this point is one of timing.
WTI Crude Oil Weekly Price Chart
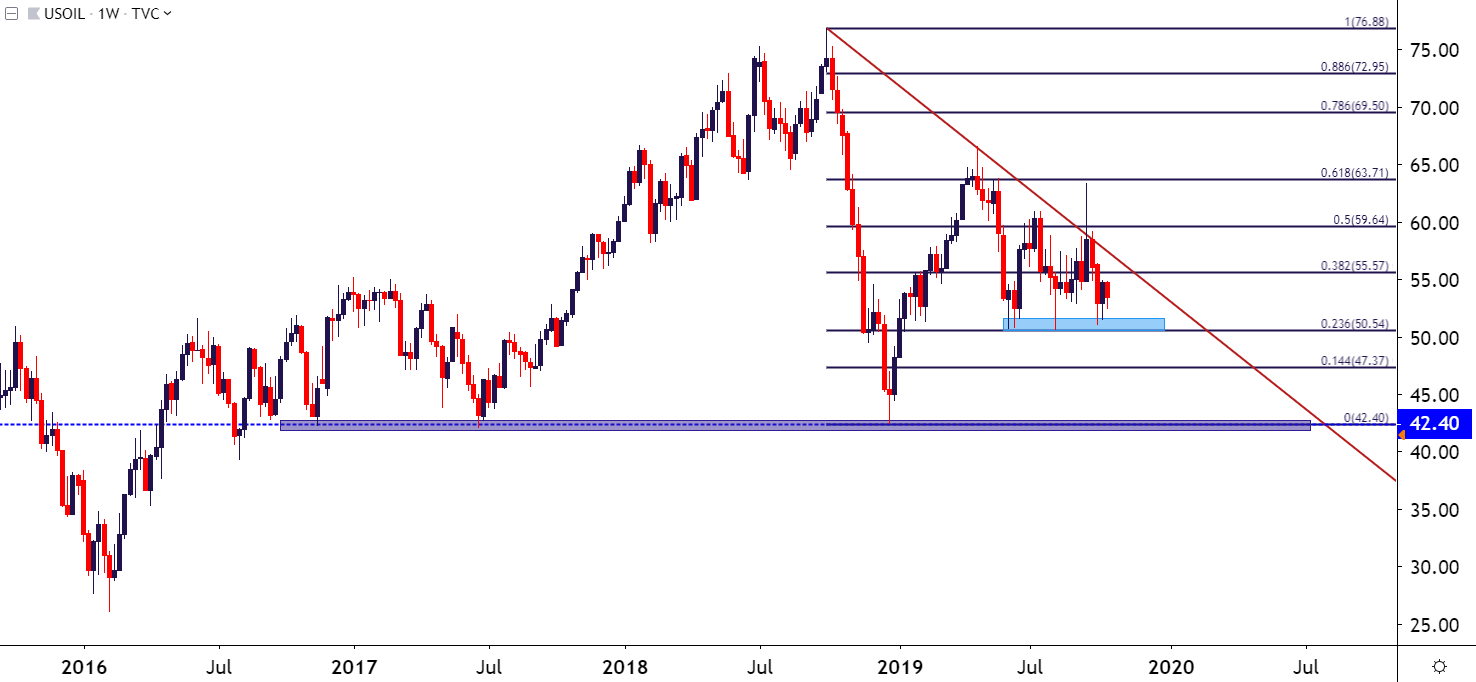
Chart prepared by James Stanley; Crude Oil on Tradingview
Crude Oil Near-Term Strategy
Given that the above scenarios around long-term bearish breakouts may take a while to fill-in, traders are faced with the choice of either waiting for the big picture support breaks or to work within the confines of near-term price action.
Current prices are building in a bear flag formation, marked by the build of a bullish trend channel after last week’s visit to support. For traders with very short-term strategies, looking for topside within continuation of the shorter-term channel could be a possible manner of moving forward. The primary complication there would be one of risk management as stops would likely need to be lodged below this week’s low to allow for better than one-to-one risk reward ratios upon re-tests of the 54.46-55.00 zone.
More attractive, however, would be another resistance test coupled with a show of sellers at that 54.46-55.00 zone to re-open the door for bearish scenarios. That side could, at the very least, carry the follow-through potential for another test of the 50.54-51.70 support area and perhaps even a break-down.
Alternatively, bear flag logic could be applied, looking for a push below the channel to re-open the door to another visit of the 50.54-51.70 area on the chart.
WTI Crude Oil Two-Hour Price Chart
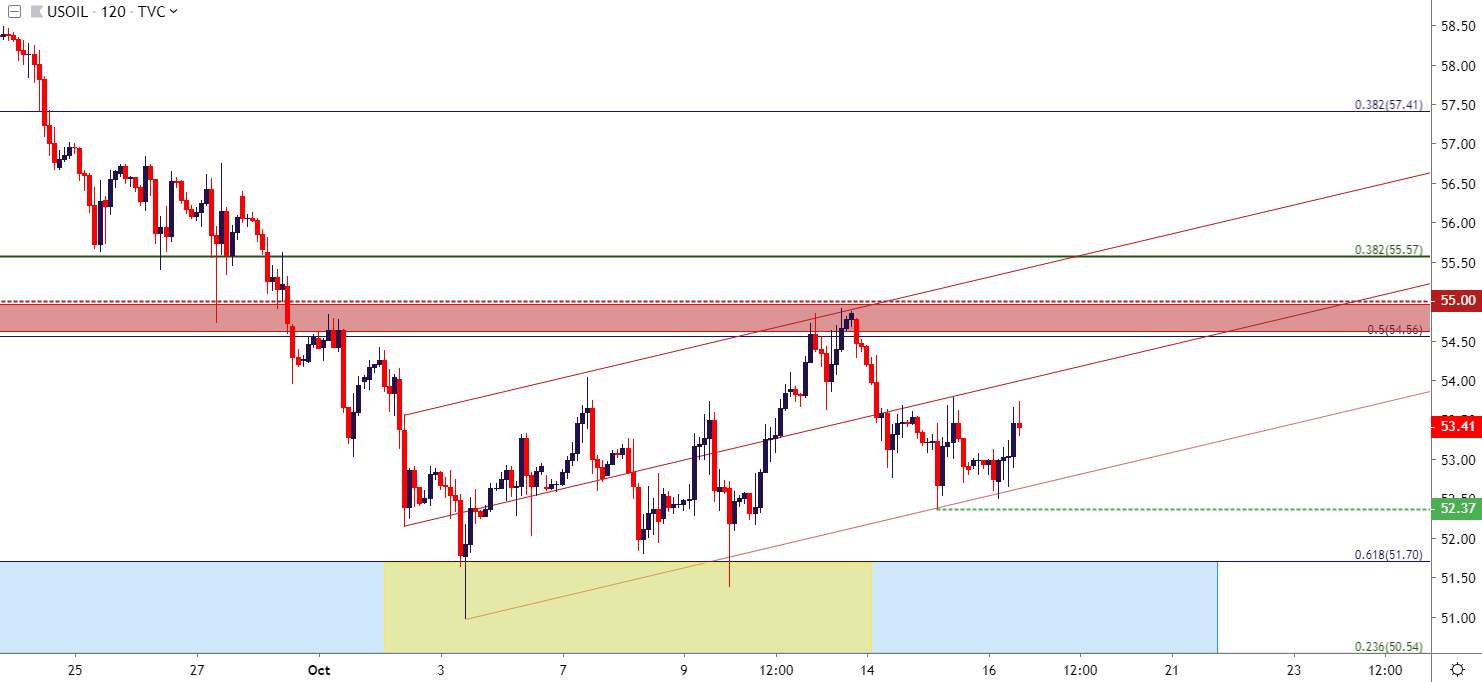
Chart prepared by James Stanley; Crude Oil on Tradingview
To read more:
Are you looking for longer-term analysis on the U.S. Dollar? Our DailyFX Forecasts have a section for each major currency, and we also offer a plethora of resources on Gold or USD-pairs such as EUR/USD, GBP/USD, USD/JPY, AUD/USD. Traders can also stay up with near-term positioning via our IG Client Sentiment Indicator.
Forex Trading Resources
DailyFX offers an abundance of tools, indicators and resources to help traders. For those looking for trading ideas, our IG Client Sentiment shows the positioning of retail traders with actual live trades and positions. Our trading guides bring our DailyFX Quarterly Forecasts and our Top Trading Opportunities; and our real-time news feed has intra-day interactions from the DailyFX team. And if you’re looking for real-time analysis, our DailyFX Webinars offer numerous sessions each week in which you can see how and why we’re looking at what we’re looking at.
If you’re looking for educational information, our New to FX guide is there to help new(er) traders while our Traits of Successful Traders research is built to help sharpen the skill set by focusing on risk and trade management.
--- Written by James Stanley, Strategist for DailyFX.com
Contact and follow James on Twitter: @JStanleyFX


