


Talking Points
-Sentiment subtly shifts towards longs suggesting further correction
-Short term support near $1210 and near $1190
-Longer term support near $1115-$1160
Gold prices dropped today on the heels of the Brussels attack yesterday. From yesterday’s high to today’s low in XAU/USD, a CFD which tracks gold, we have a $45 range or over 3% of the price. This negative price action over the emotional two day period suggests the pressure in the short term on gold is to the down side.
Taking a look at SSI, a sentiment reading, we can see SSI is creating a positive slope while traders have shifted towards bulls (see image 1 below). This is a subtle shift that is indicative of the correction lower. Typically we see price move in the opposite direction of SSI. So a positively sloping SSI reading suggests a negative bias on gold prices.
We’ll be on watch for an SSI reading that shifts more negative by following trader positioning at DailyFX.

[Image 1]
From a technical perspective, the gold price correction does not appear to be complete. Shorter term, there are two wave relationships showing up near $1210. Though today’s low of $1215 might be close enough to satisfy the shorter term correction, the medium term retracement has been rather shallow at near 25% in price.
Elliott Wave technical analysis would suggest perhaps a deeper dip into the $1190-$1195 price zone may offer a compelling risk to reward ratio opportunity to the upside (see left side of image 2).
Additionally, my colleague Kristian Kerr noted back in February how late March/early April is an important juncture from a timing perspective.
I have generally believed that if the metal is going to really turn things around and embark on any sort of meaningful move higher this year then it would probably have to put in a low sometime around late March/early April.
Kristian Kerr, Gold – Is the Bear Market Finally Over? (February 10, 2016)
Bottom line, if we see gold price push down into $1190 region with real time SSI pushing more negative levels within the next 2 weeks, we have symptoms of a bottom forming.
If gold prices continue to retreat below $1190 in earnest, then we’ll likely activate the alternative Elliott Wave count which suggests we are in a larger B wave (see right side of image 2 below).
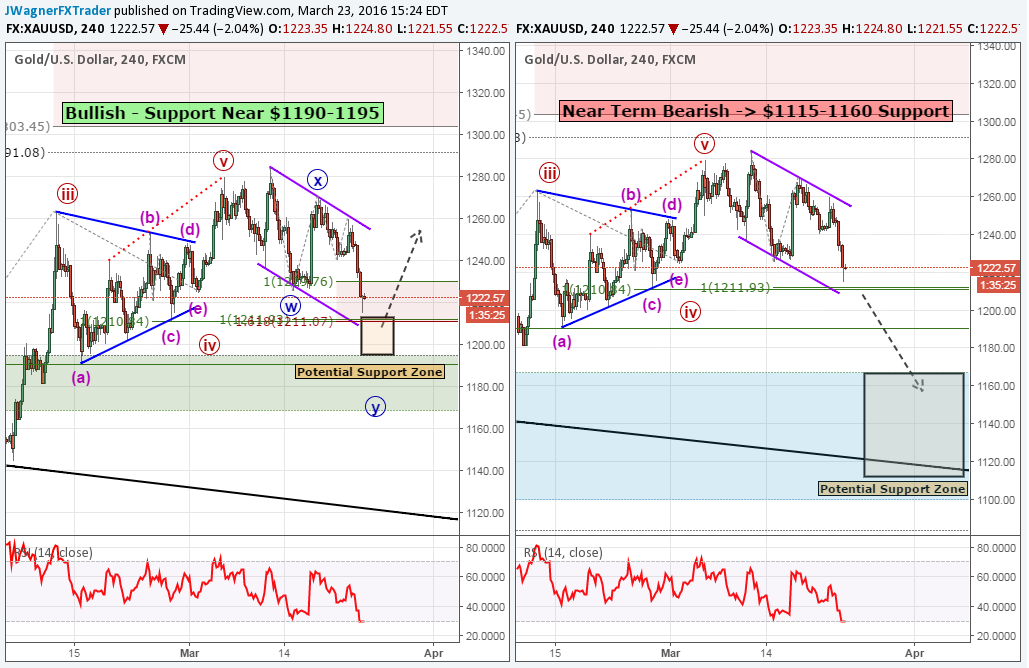
[Image 2]
During this B wave move lower, we’ll look for prices to retrace 50-78% of the previous up trend. That would place initial targets towards $1115-1160. The timing window of late March/early April would also apply to this scenario as well. This alternate, though more bearish on the immediate term, would call for a stronger bullish move once the bottom is set.
Gold was a market both fellow analyst Kristian Kerr and I dubbed in our 2016 Top Trading Opportunities Guide. To read more about those opportunities plus 12 other different opportunities from the DailyFX team, download the 2016 Top Trading Opportunities Guide.
Happy Trading!
---Written by Jeremy Wagner, Head Trading Instructor, DailyFX EDU
Follow me on Twitter at @JWagnerFXTrader .
See Jeremy’s recent articles at his Bio Page.
To receive additional articles from Jeremy via email, join Jeremy’s distribution list.
Experience no re-quotes on your Gold trades. Learn more here (non-US residents only).


