


Talking Points
- EUR/USD Traders Higher to Create weekly Highs
- Current EUR/USD Support is Found Near 1.1240
- What’s next for the EUR/USD and US Dollar Pairs? Learn more with our Trading Guide
The EUR/USD is trading near daily highs after breaking out above resistance at 1.1240 in early trading. This move has been predicated on a general US Dollar selloff against most major pairs, including the EUR/USD. Fundamentally, traders may look towards Friday’s U.S. CPI release to gain further insight on longer trends for the US Dollar. Expectations are set at 1.0% (YoY) (AUG), but any deviation from this value may directly impact the EUR/USD. In the short term, traders may continue to monitor 1.1240 as a point of support and the current high of 1.1274 as a point of resistance.
EUR/USD, 30 Minute Chart with Breakout
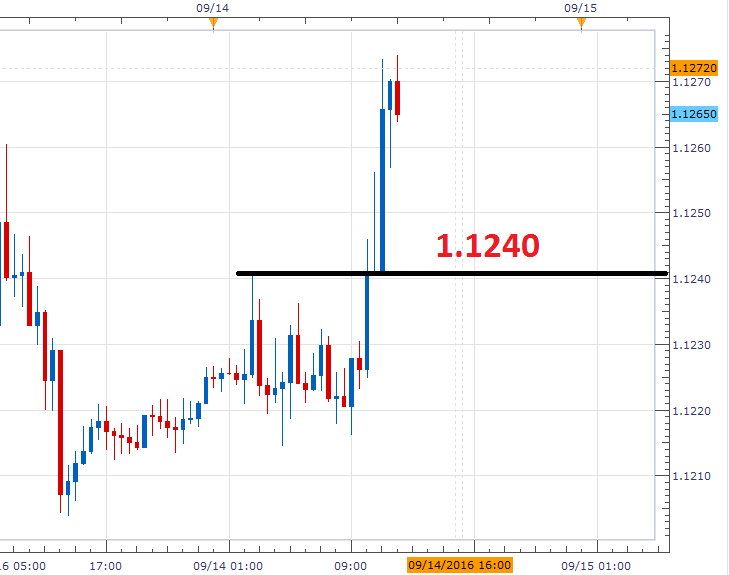
(Created using Marketscope 2.0 Charts)
In the 3-minute graph below, the EUR/USD can be seen breaking out higher in this morning’s trading. The Grid Sight Index (GSI) has interpreted this move as a developing short-term uptrend by identifying a series of higher highs on the chart. After reviewing 36,008,315 pricing points, GSI has indicated that price action has continued to advance by 10 pips or more in 63% of the reported 38 historical matching events. It should be noted that the first displayed bullish distribution is found at 1.1281. A move through this point would have the EUR/USD trading at new daily and weekly lows.
Alternatively, GSI has indicated that prices have advanced by 31 pips or more in 33% of the 38 historical matches. Today’s first bearish historical distribution is found at 11240. A move through to this value would be significant, as it would place the EUR/USD back at the origin of this morning’s breakout. In this scenario, traders may look for a breakout below this vale to signal the beginning of a new short-term uptrend. Alternatively, a bounce at this level would suggest a potential retracement back towards values of resistance
Want to learn more about GSI? Get started learning about the Index HERE.

To Receive Walkers’ analysis directly via email, please SIGN UP HERE
See Walker’s most recent articles at his Bio Page.
Do you know the biggest mistake traders make? More importantly, do you know how to overcome the biggest mistake? Read page 8 of the Traits of Successful Traders Guide to find out [free registration required].
Contact and Follow Walker on Twitter @WEnglandFX.


