

Gold Prices, XAU/USD, Iran Tension – TALKING POINTS
- XAU/USD about to face selling pressure, bearish correction?
- Gold prices looking to retest resistance-now-turned support?
- Cooling Iranian tensions sapping demand for anti-fiat hedges
Gold prices have risen almost six percent following the breakout above the September descending resistance channel. XAU/USD’s strong ascent was supported by a number of factors, including the weakest US ISM manufacturing data since 2009 on January 3. This led to a spike in gold prices which then went on to experience their largest one-day jump since August.
December Minus January Federal Funds Futures Contract, Gold Prices – Daily Chart
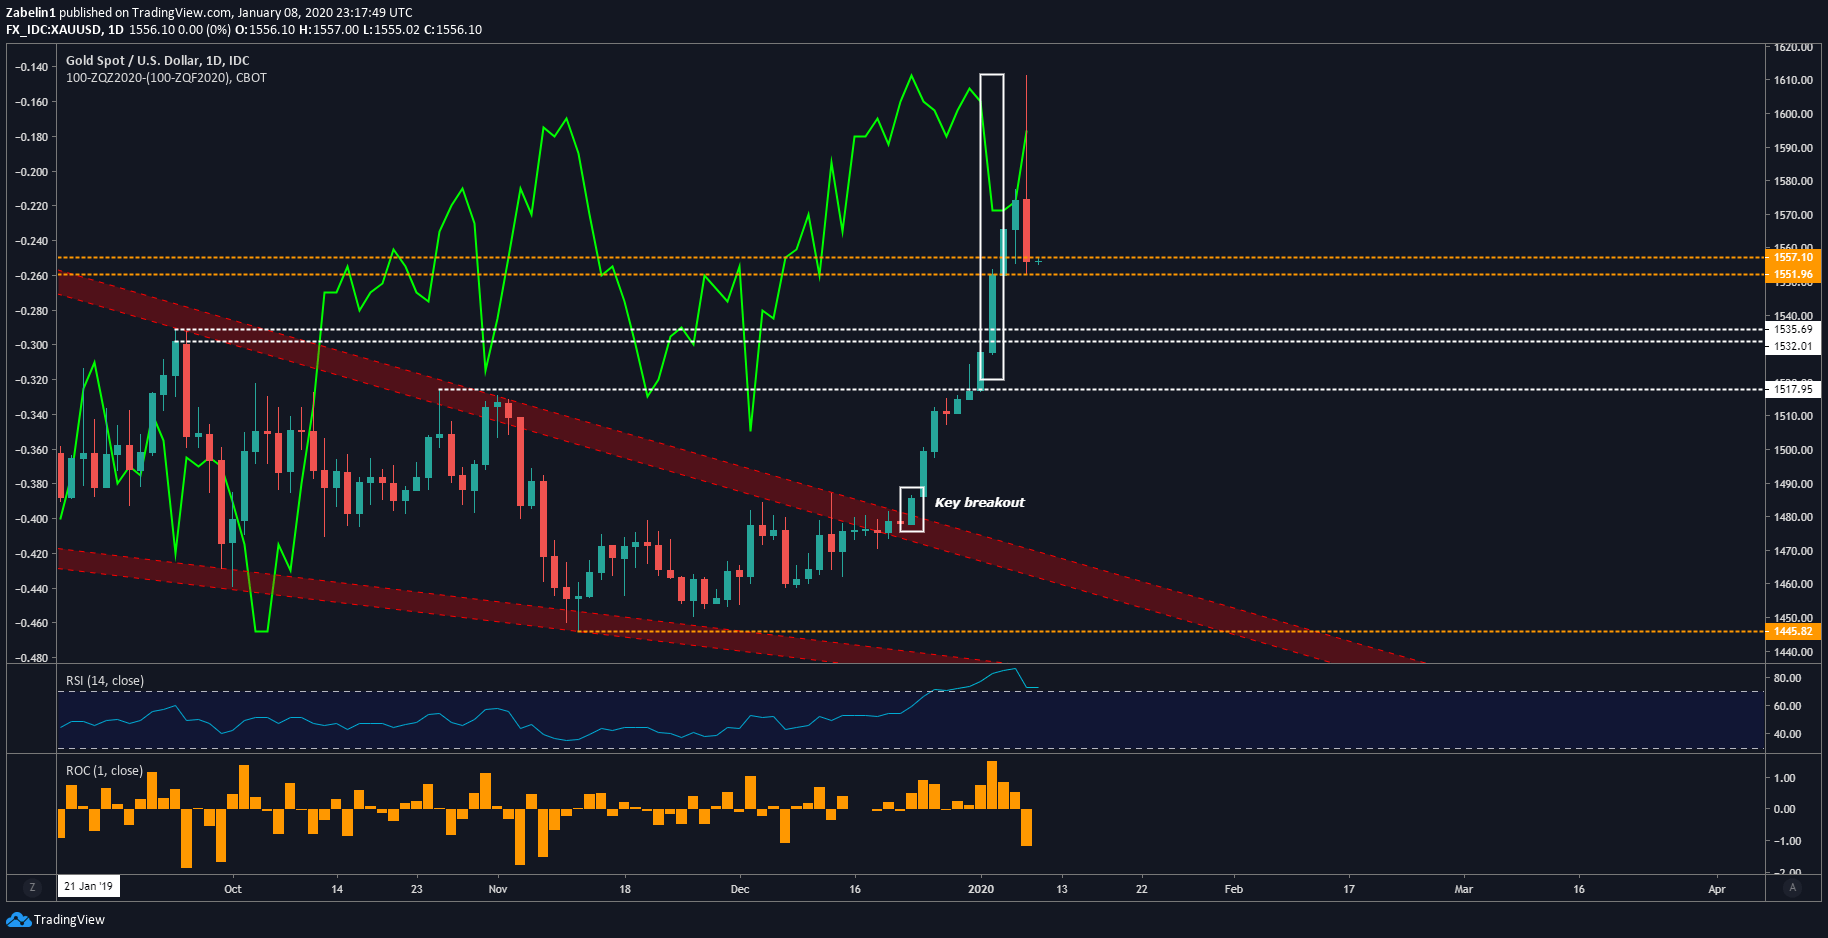
XAU/USD chart created using TradingView
The yellow metal’s rise came after the statistic inflamed 2020 Fed rate cut bets, simultaneously boosting demand for anti-feat hedges. This precious metal’s rise was buttressed by a rise in geopolitical tensions between Iran and the US as risk aversion gripped markets. However, tensions have since cooled, sending gold prices down to a familiar range between 1551.96 and 1557.10 (gold-dotted lines).
The long wick on the January 8 candle illustrates a strong desire among market participants to continue higher, but ultimately conviction was lacking. XAU/USD ultimately ended the day over-one percent lower. Looking ahead, gold prices may find themselves hovering between 1535.69 and 1551.96 if traders remain undecided as to how they want to commit capital.
If the XAU/USD manages to trade above the 1551.96-1557.10 zone with follow-through, it could act as a new interim-support level. Conversely, failure to stay above this zone could be met with disappointment, potentially leading to a selloff until the precious metal hits 1517.95.
Gold Prices – Daily Chart
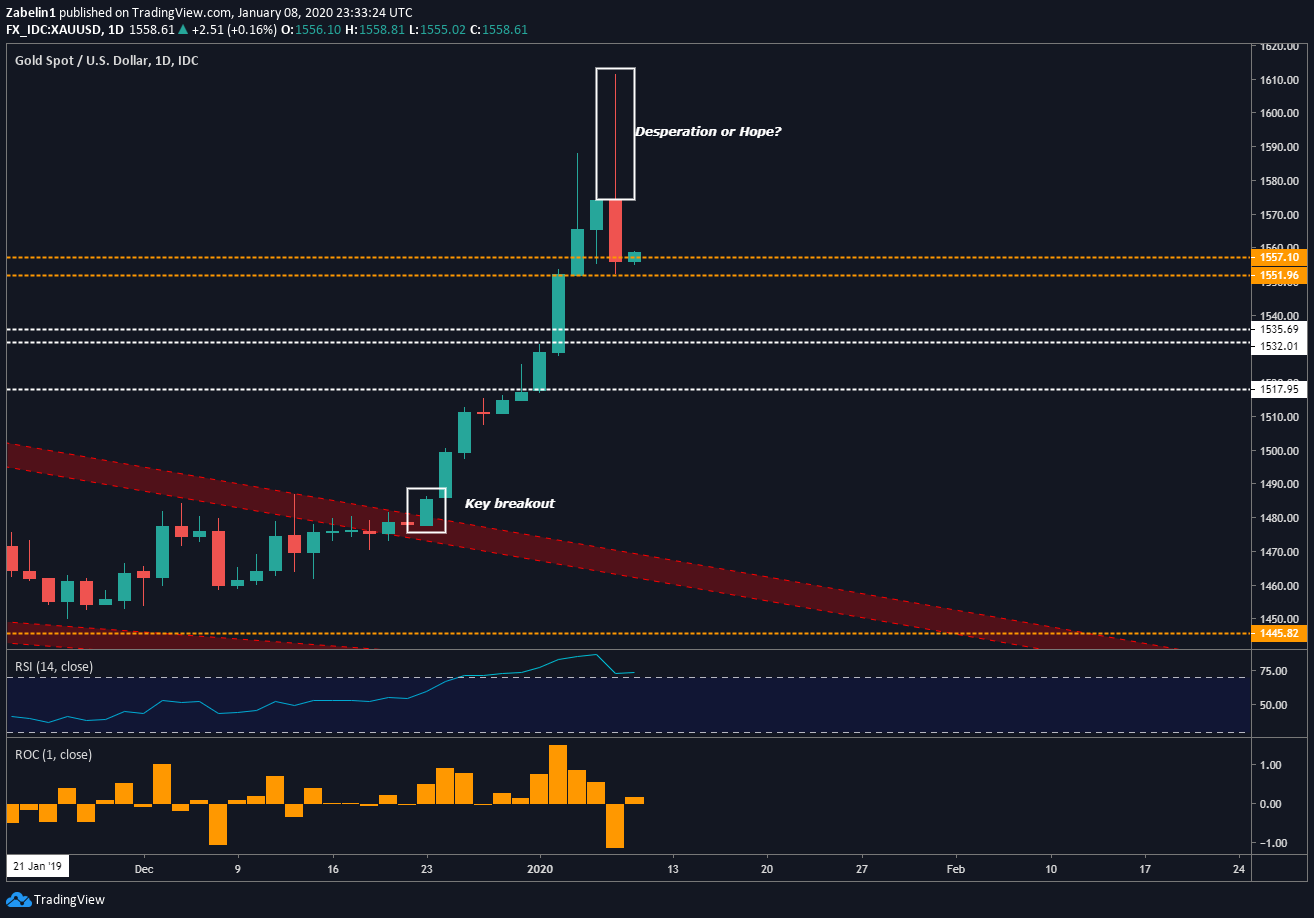
XAU/USD chart created using TradingView
GOLD TRADING RESOURCES
--- Written by Dimitri Zabelin, Jr Currency Analyst for DailyFX.com
To contact Dimitri, use the comments section below or @ZabelinDimitri on Twitter