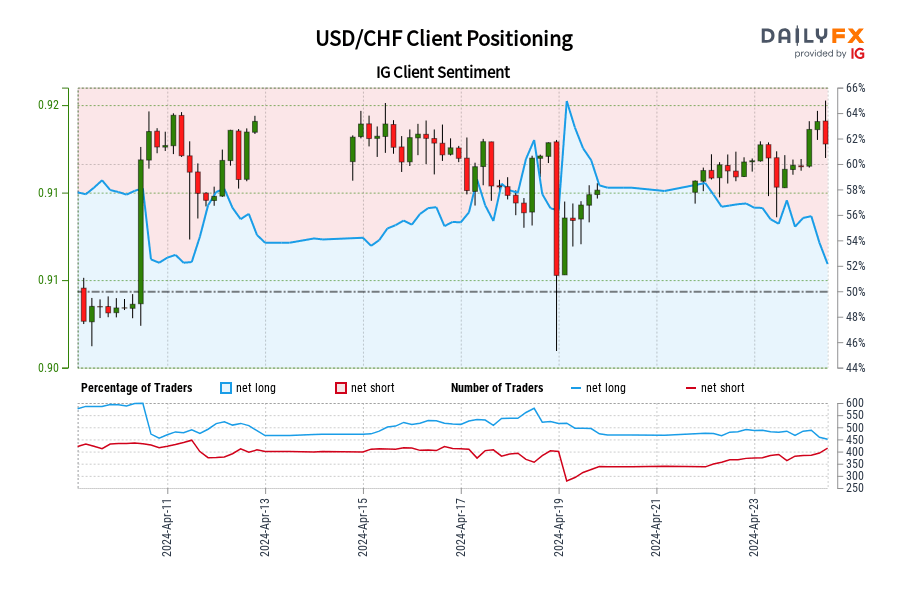
Skip to Content
News & Analysis at your fingertips.

We use a range of cookies to give you the best possible browsing experience. By continuing to use this website, you agree to our use of cookies.
You can learn more about our cookie policy here, or by following the link at the bottom of any page on our site. See our updated Privacy Policy here.

Free Trading Guides
Subscribe
Please try again
Select

Live Webinar Events

0

Economic Calendar Events

0

Notify me about

Live Webinar Events
Economic Calendar Events

H

High

M

Medium

L

Low
More View More

Dollar - Swiss Franc Chart

USD/CHF
Bullish
Clock icon 26m
Last updated: Mar 19, 2024
Low
High
of clients are net long. of clients are net short.
Average True Range
Total Intraday Range (% of ATR)
Note: Low and High figures are for the trading day.
The USDCHF currency pair is often called 'The Swissie'. The Swiss Franc is the last Franc still in issuance in Europe. CHF is shorthand for 'Confoederatio Helvetica' Franc, and represents the economy of the neutral nation situation in the center of Europe. Switzerland has long been a key banking center for customers around the world, and the secrecy with which they maintain their banking operations has made them one of the more desireable locations for storing cash. This has helped to bring considerable strength to the Swiss Franc, pressuring exporters from the nation. When the European Debt Crisis enveloped the continent, massive inflows into Swiss Francs made the situation worse until eventually the Swiss National Bank (SNB) created a peg to the Euro at a rate of 1.2 Swiss Francs for every 1 Euro. If the EURCHF currency pair fell below 1.20, the SNB proposed to sell CHF and buy EUR to support the 1.20 floor.

Support & Resistance

Pivot Points

S3 0.88797
S2 0.88867
S1 0.88894
R1 0.88964
R2 0.89007
R3 0.89077
P 0.88937
Daily Classical Pivot Points. Last Updated: Mar 19, 2024
Advertisement

Real Time News

DailyFX Mar 19, 2024
The Bank of England (BOE) is the UK’s central bank. Their mission is to promote and maintain monetary and financial stability. https://t.co/pfiiKiw6D8 https://t.co/zhPp8skxNL
2024-03-19 09:06:05
DailyFX Mar 19, 2024
MACD who? The Moving Average Convergence Divergence (MACD) is a technical indicator that simply measures the relationship of exponential moving averages (EMA). Find out how you can incorporate MACD in your trading strategy here: https://t.co/ZNs4Qi8ieG https://t.co/9cS4X8b3a8
2024-03-19 08:06:05
DailyFXTeam Mar 19, 2024
IG Client Sentiment Update: Our data shows the vast majority of traders in Silver are long at 77.38%, while traders in France 40 are at opposite extremes with 81.50%. See the summary chart below and full details and charts on DailyFX: https://t.co/QeYdESR2tp https://t.co/aY26fQduSh
2024-03-19 07:45:02

IG Client Sentiment

Related News & Analysis

pages/technicalSentiment.related-events

Advertisement

Economic Calendar

12:30:00
H
Building Permits Prel (Feb)
A:
F: 1.495M
P: R: 1.489M
12:30:00
M
Building Permits MoM Prel (Feb)
A:
F:
P: R: -0.3%
12:30:00
M
Housing Starts MoM (Feb)
A:
F:
P: R: -14.8%
12:30:00
L
Housing Starts (Feb)
A:
F: 1.425M
P: R: 1.331M
12:55:00
L
Redbook YoY (Mar/16)
A:
F:
P: R: 3%
15:30:00
L
52-Week Bill Auction ()
A:
F:
P: R: 4.695%
Advertisement