


Natural Gas, Range Bound, Bearish Death Cross – Technical Update:
- Natural gas prices remain in a steady state so far this year
- Breaking the August trendline has been a notable milestone
- Lackluster progress keeps the focus on near-term price action
Trade Smarter - Sign up for the DailyFX Newsletter
Receive timely and compelling market commentary from the DailyFX team
Daily Chart – Range-Bound Price Action
Natural gas prices have been in a consistent range-bound price action since February. In June, prices confirmed a breakout above the long-term falling trendline from August. That opened the door to a broader upside technical bias. Since then, bullish progress has been somewhat lackluster. Key resistance remains at the March high of 3.027.
Confirming a push higher above this price opens the door to pushing upward, exposing the 23.6% Fibonacci retracement level at 3.297 followed by the 38.2% point at 4.12. Otherwise, turning lower from here places the focus on the current 2023 low around 1.97. This is critical support that if remains in play, opens the door to resuming consolidation.
Let us zoom in on the 4-hour chart to see if we can get a better idea of what may be in store for the heating commodity in the week ahead.
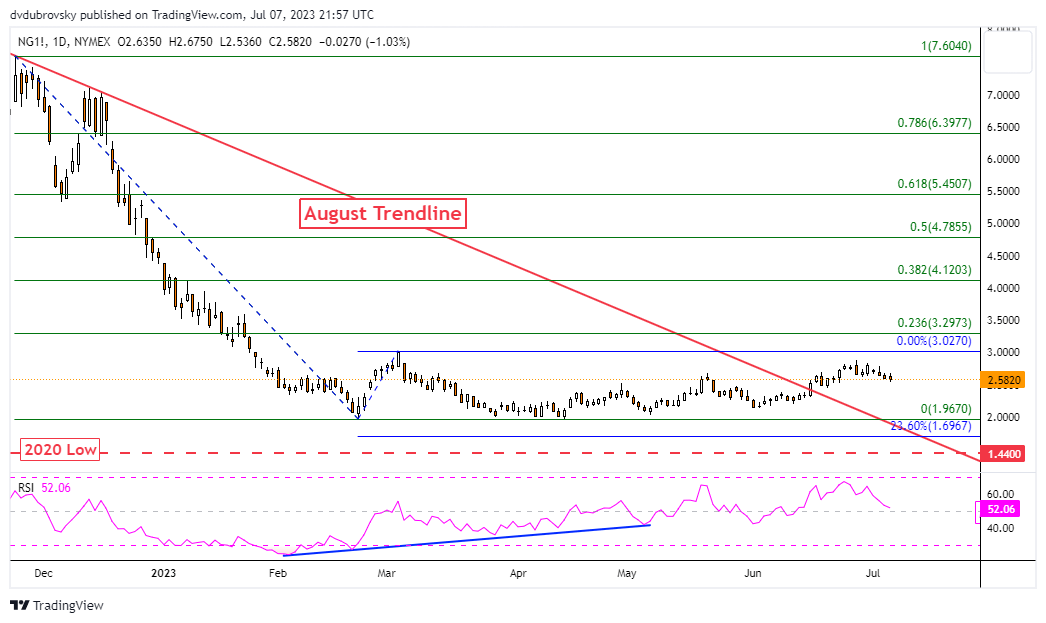
Chart Created Using TradingView
4-Hour Chart – Bearish Death Cross?
The 4-hour chart reveals a couple of critical technical developments. The first is that the recent near-term turn lower was preceded by negative RSI divergence. That is a classic signal of fading upside momentum. Now, it appears that the 50- and 100-period Simple Moving Averages may crossover ahead. That would create a bearish Death Cross.
Such an outcome would offer an increasingly bearish technical bias for the week ahead. Immediate support is the midpoint of the Fibonacci retracement level in the chart below at 2.507. Further losses would expose the 61.8% point at 2.419. Just beyond that is a near-term rising trendline from the middle of April that has been maintaining a cautious upside short-term technical bias.
In the event of a turn higher, clearing the June high of 2.878 opens the door to revisiting the March peak mentioned in the daily chart analysis at 3.027.

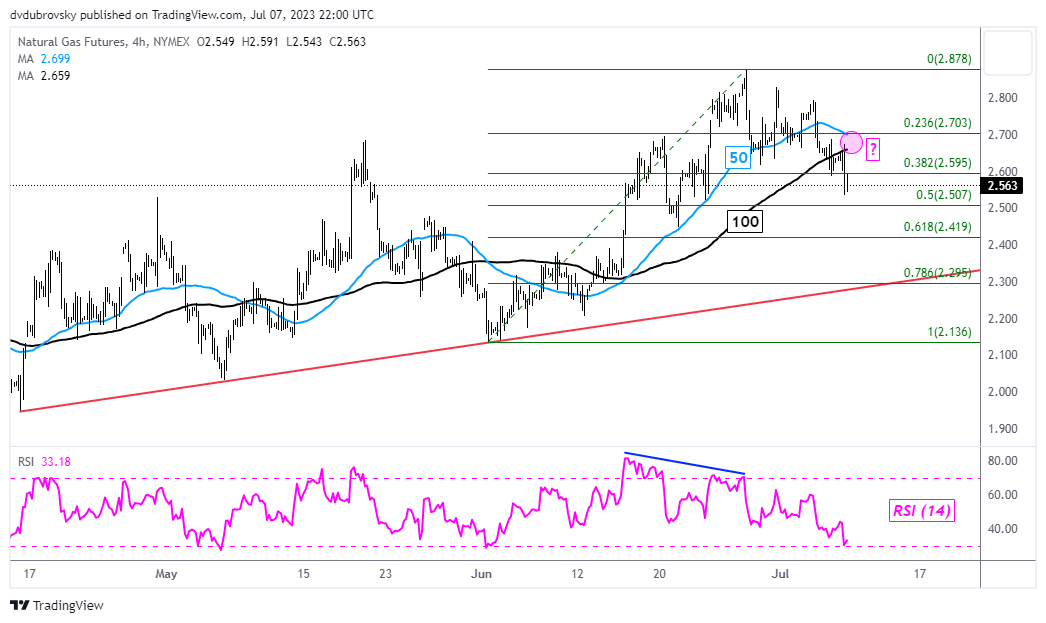
Chart Created Using TradingView
--- Written by Daniel Dubrovsky, Senior Strategist for DailyFX.com
To contact Daniel, follow him on Twitter:@ddubrovskyFX


