


Natural Gas, Bearish Death Cross, Support Breakout – Technical Update:
- Natural gas prices aimed cautiously lower over past 2 weeks
- Daily price action continues to underscore a neutral view
- Meanwhile, 4-hour chart is showing bearish developments
Trade Smarter - Sign up for the DailyFX Newsletter
Receive timely and compelling market commentary from the DailyFX team
Daily Chart
Natural gas prices cautiously weakened this past week. In total, the heating commodity is down about 2.3% over the past 2 weeks. That is the worst performance over this interval since early July. Still, despite the cautious decline, natural gas remains in a neutral price setting.
On the daily chart below, you can see that the heating commodity has struggled to make meaningful upside progress ever since clearing the falling trendline from August. In fact, since the beginning of this year, natural gas has been ranging between 3.027 and 1.967.
That said, because of the sideways price action, the 200-day Moving Average has been quickly nearing current price levels. It currently sits above the 23.6% Fibonacci retracement level at 3.297. Further range-bound price action could bring the MA closer to current levels, perhaps maintaining the downside focus.
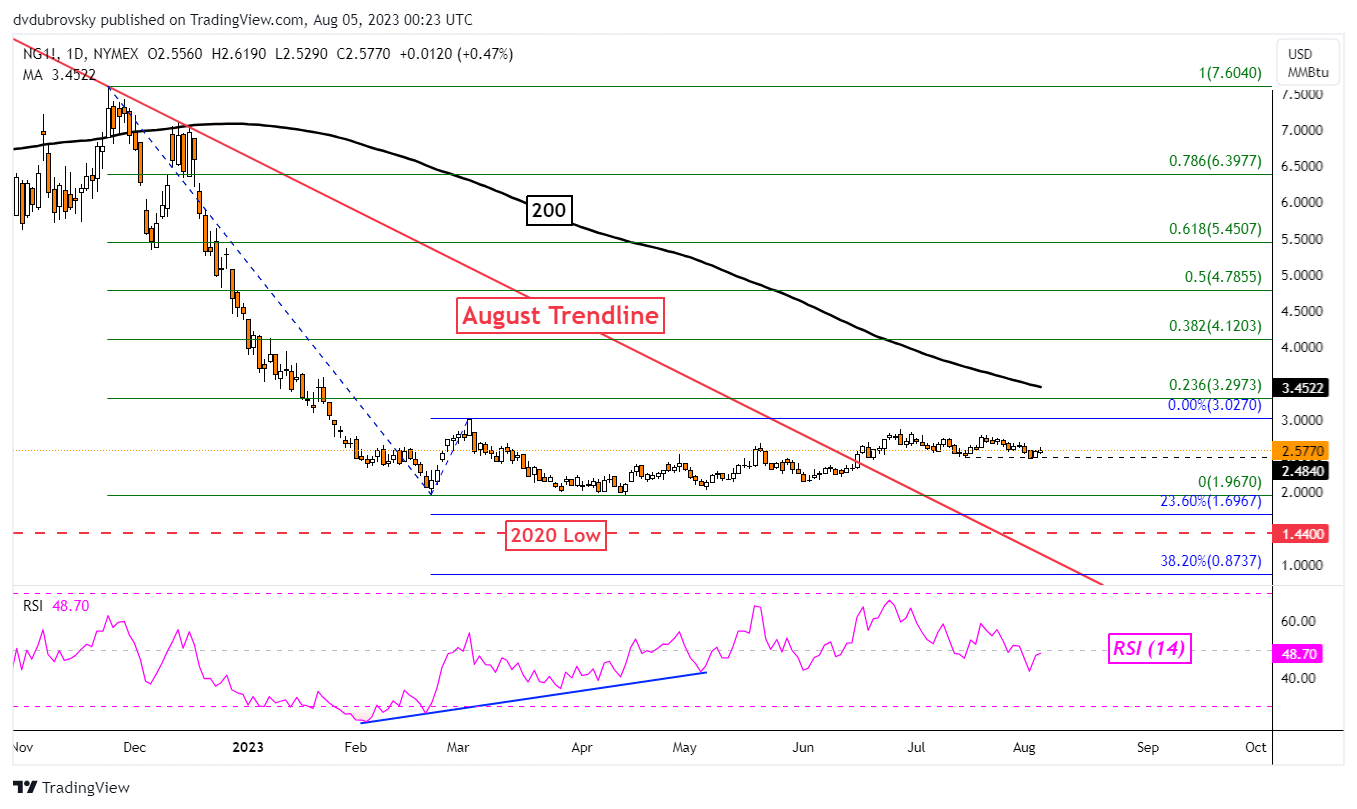
Chart Created Using TradingView
4-Hour Chart
Zooming in on the 4-hour chart offers a more interesting development of price action. For starters, natural gas has confirmed a breakout under a rising zone of support from June. This past week, prices fell to the midpoint of the Fibonacci retracement level at 2.507 before bouncing back to rising support.
The latter held as new resistance, maintaining the integrity of the trendline breakout. Meanwhile, a bearish Death Cross has formed between the 50- and 100-period Moving averages. This is adding fuel to the near-term bearish perspective.
That said, a confirmatory breakout under 2.507 would underscore a bearish view considering price action on the daily setting. Further losses may open the door to a revisit of June lows.

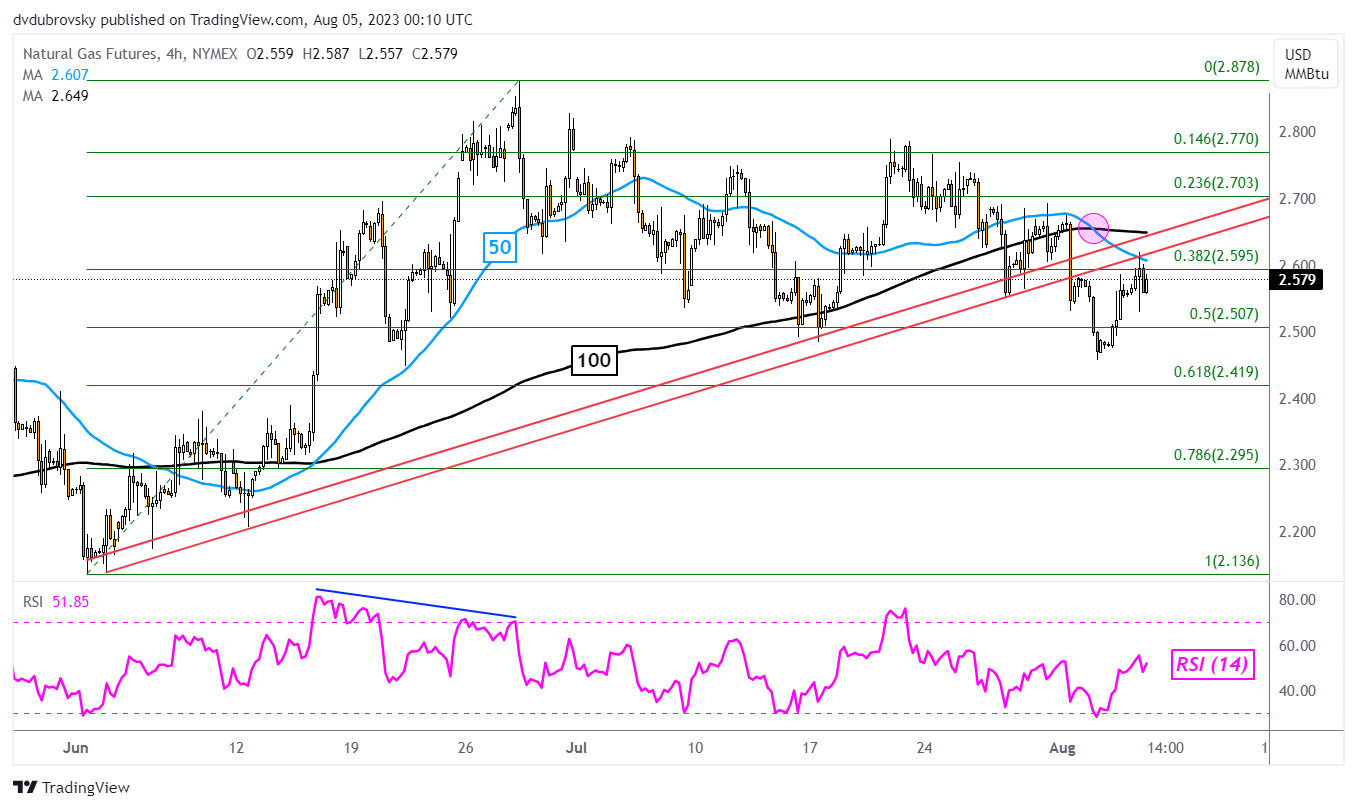
Chart Created Using TradingView
--- Written by Daniel Dubrovsky, Senior Strategist for DailyFX.com


