


Gold, XAU/USD, US Dollar, GC1, Momentum, Bulls vs Bears - Talking Points
- The gold price eyed off a 3-month low in the last 24 hours
- The ensuing rally might have created an intriguing technical environment
- Going forward, there could be some vital levels to watch. Where to for XAU/USD?

Gold has tried lower but rallied off the floor after the US Dollar took a turn in the aftermath of rate decisions from the Federal Reserve and the European Central Bank this week.
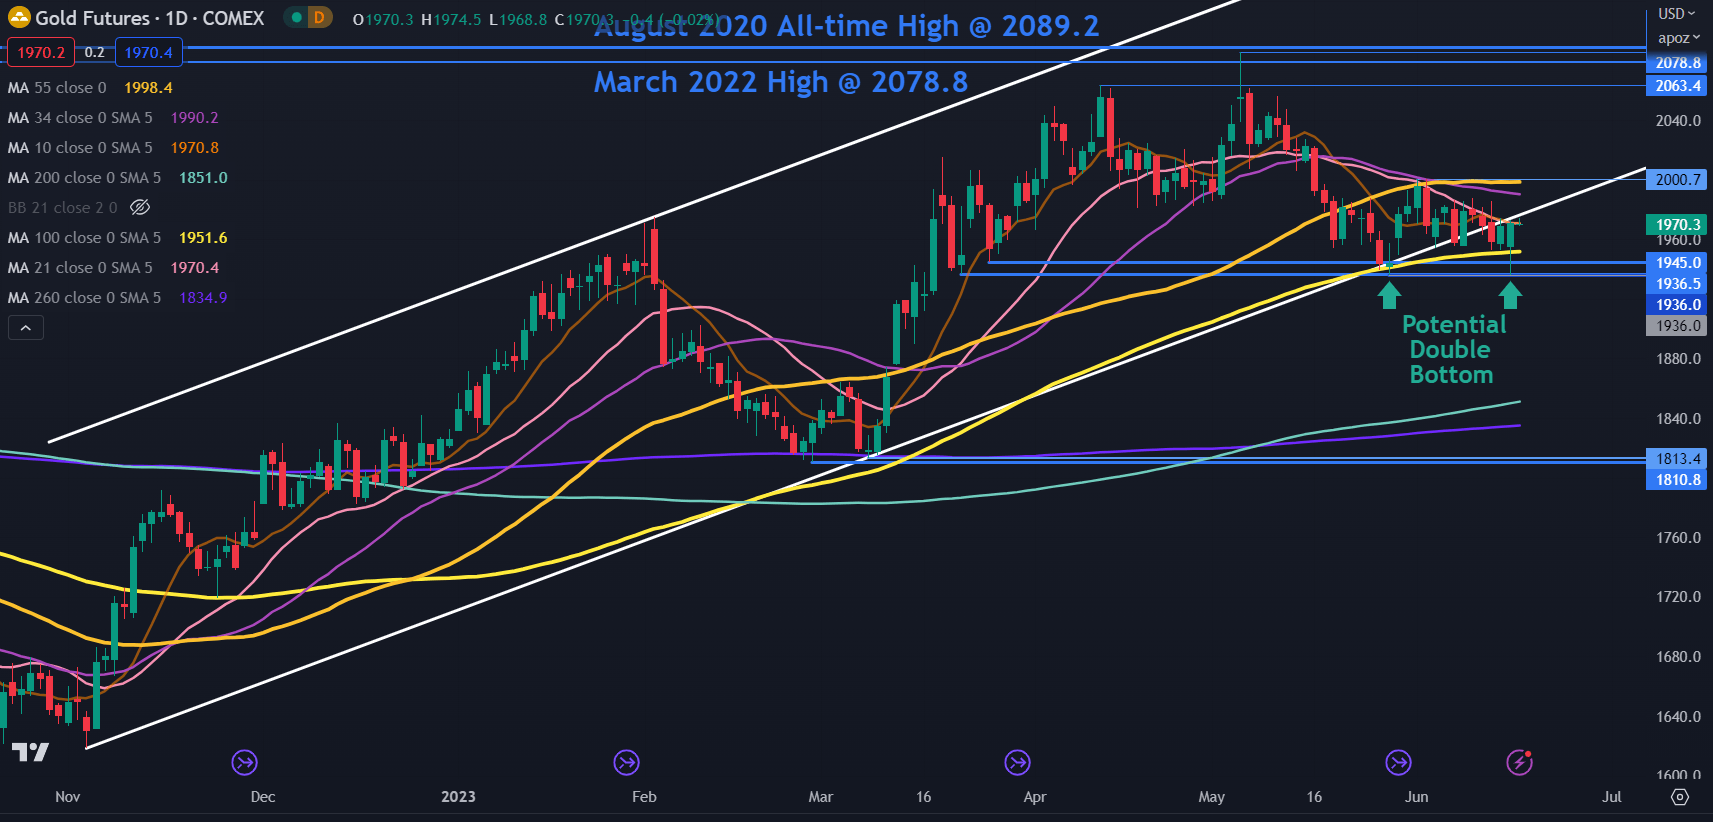
GC1 (GOLD FRONT FUTURES CONTRACT) TECHNICAL ANALYSIS
Gold’s recent dip below an ascending trend line and subsequent test of support levels in the 1936 – 1945 area might ask more questions than it answers.
Thursday’s low of 1936 has set up a potential Double Bottom that coincides with a previous low. The potential Double Bottom could be confirmed should it move above the neckline at 2000.
The push lower went under the 100-day Simple Moving Average (SMA) but the daily close was back above it.
This may suggest that recent bearishness could have been rejected by the market for now and that the 1936 – 1945 zone might remain supportive.
A clean break below that area may see a bearish run evolve, and the next support zone of note could be at the next Double Bottom of 1811 and 1813.
Trade Smarter - Sign up for the DailyFX Newsletter
Receive timely and compelling market commentary from the DailyFX team
While the price is above the 100-, 200- and 260-day SMAs, it remains below all other shorter-period SMAs. If gold gets above the 55-day SMA, currently dissecting at 2000, it will be above all period daily SMAs, which may suggest that bullish momentum is evolving.
This potentially opens up 2000 as a critical level for gold to overcome if it is to reignite bullish momentum.
If it does break above 2000, it could run for the crucial resistance zone ahead of the all-time high.
The early May high of 2085 eclipsed the March 2022 peak of 2079 but was unable to overcome the all-time high of 2089. This failure to break new ground to the upside has created a Triple Top which is an extension of a Double Top formation.
This has set up a potential resistance zone in the 2080 – 2090 area but a snap above those levels may indicate further evolving bullishness. The next level of resistance could be at the upper ascending trend channel line that is currently near 2190.
--- Written by Daniel McCarthy, Strategist for DailyFX.com
Please contact Daniel via @DanMcCathyFX on Twitter


