


Euro, EUR/USD, RSI Divergence – Technical Update:
- Euro at 6-week loss, 7th would mean longest since 2014
- EUR/USD confirms breakout under key rising support
- Watch for positive RSI divergence on the 4-hour chart

At 6 weeks, the Euro is on its longest consecutive losing streak against the US Dollar since 2018. A further 7th decline would mean the longest since 2014. So far this month, the single currency is down about -1.9 percent, marking the worst monthly performance potentially since May. With that in mind, how is the short-term technical landscape shaping up?
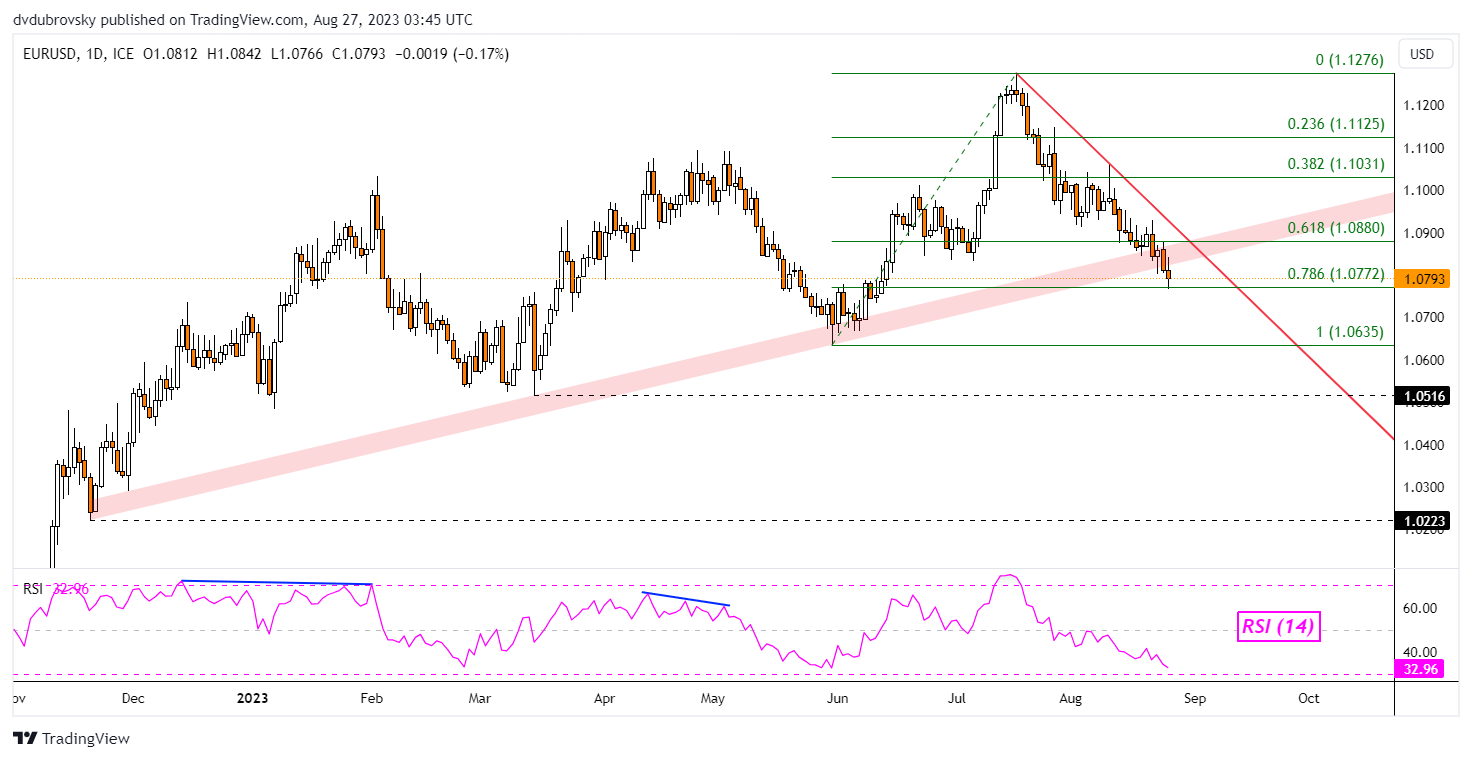
On the daily chart below, the Euro has confirmed a breakout under the key rising zone of support from the end of 2022. On Friday, the exchange rate closed just above the 78.6% Fibonacci retracement level of 1.0772, establishing it as immediate support. Further downside progress could open the door to revisiting the May low of 1.0635.
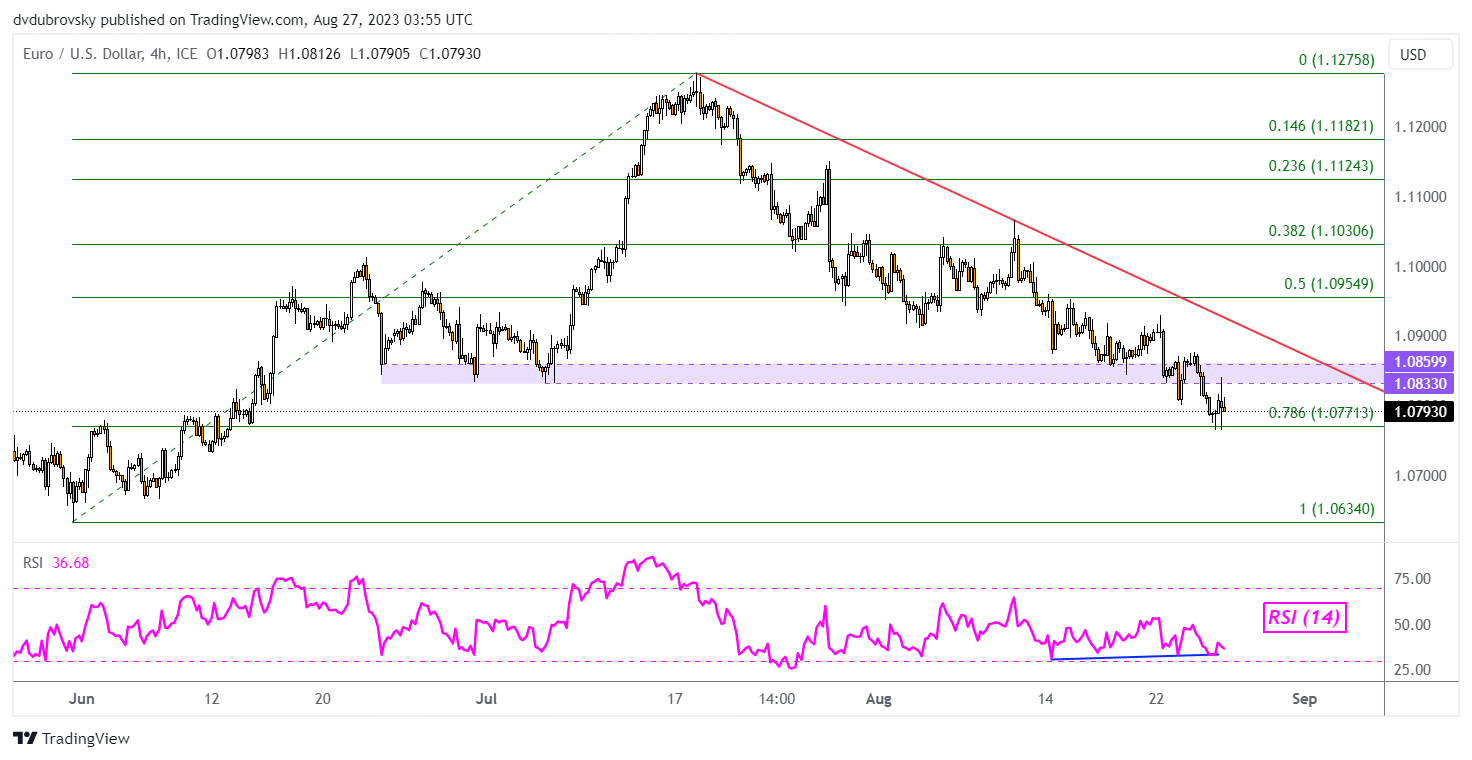
Taking a closer look at the 4-hour setting can give us a better idea of how immediate price action could be setting up. We can see that positive RSI divergence is present, showing that downside momentum is cautiously fading. This occurred right as prices fell to 1.0771 (noted on the daily chart analysis above). This could be a preliminary reversal warning.
In such a case, keep a close eye on the 1.0833 – 1.0859 former support zone from late June. This could establish itself as new resistance. But, even if the Euro can push above that, the next critical point will be the falling trendline from July. This has been maintaining the near-term downward technical bias. A breakout above it would open the door to an increasingly bullish perspective.

--- Written by Daniel Dubrovsky, Senior Strategist for DailyFX.com


