

Major Indices Talking Points and Analysis:
- Dow Jones edges lower after hawkish FOMC minutes
- Nasdaq 100 at new high with Nvida's strong earnings likely to support the bullish trend
- Nikkei rebounds
Dow edges lower after Fed minutes
The index continues to drift back, consolidating after the gains of late April and early May.
The Fed minutes indicated that some policymakers remained worried about a lack of progress on inflation. In addition, some of the FOMC remained open to more rate hikes in order to bring inflation under control.
In the short-term, the previous highs at 39,287 could form possible support, while below this lies the 50-day simple moving average (SMA). Fresh upside would come with a close back above 40,000.
Dow Jones Daily Chart
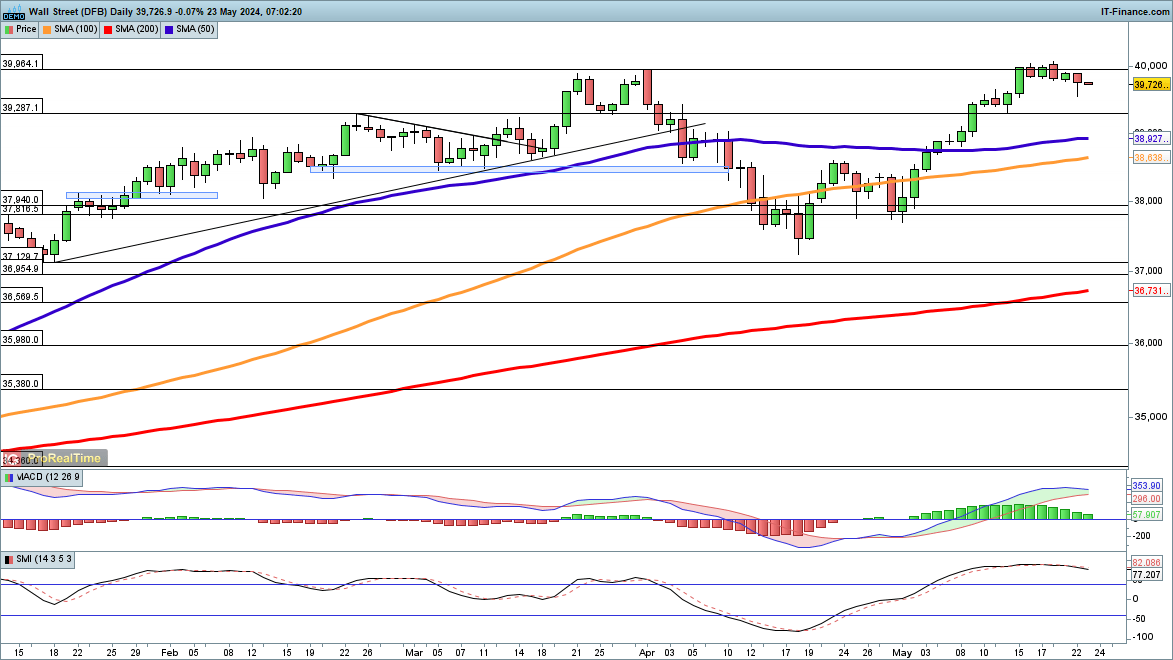
Source: IG, ProRealTime, prepared by Chris Beauchamp
Discover the power of crowd mentality. Download our free sentiment guide to decipher how shifts in AUD/USD's positioning can act as key indicators for upcoming price movements.
| Change in | Longs | Shorts | OI |
| Daily | -12% | 2% | -5% |
| Weekly | 17% | -10% | 2% |
Nasdaq 100 at new high
Earnings from Nvidia helped to drive the price to a new record,
Unlike the Dow, the index has been able to maintain its gains, and remains above the previous record high of 18,352, set back in March.
Short-term weakness may develop with a close back below this previous high.
Nasdaq Daily Chart
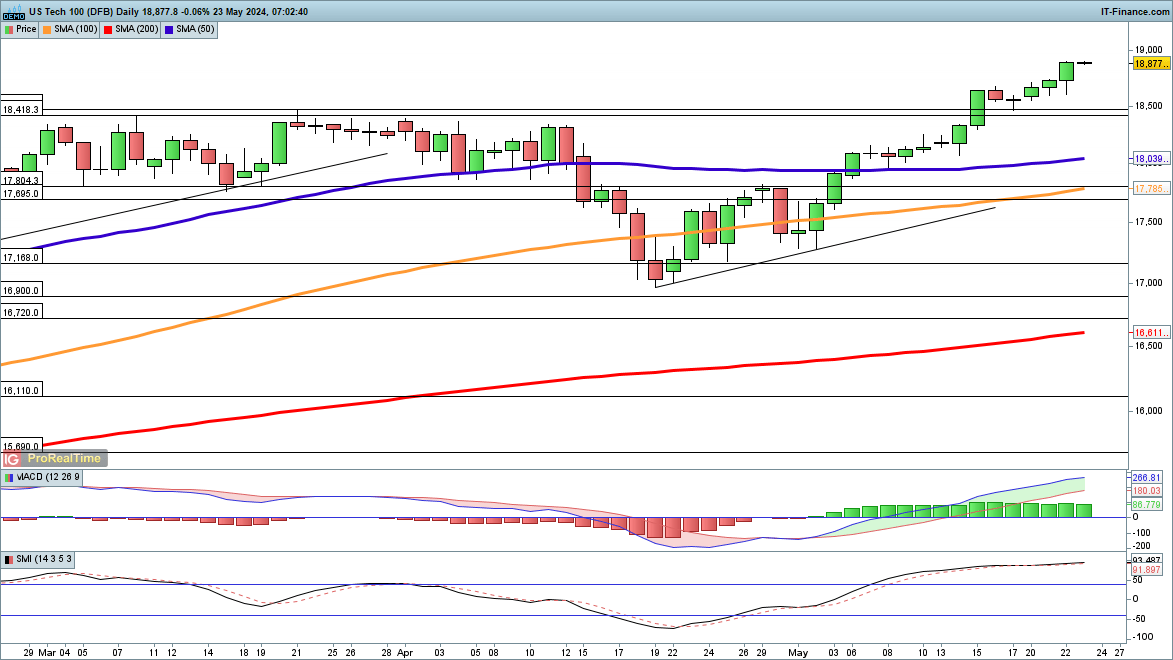
Source: IG, ProRealTime, prepared by Chris Beauchamp
Nikkei 225 rebounds
While the price slipped below the 50-day SMA on Wednesday, but was able to recover following Nvidia’s earnings.
This leaves the move higher from mid-April intact, especially given the test of trendline support from the April low. A close back above 39,000 would reinforce the bullish view, and set up a test of trendline resistance from the March highs.
A close back below trendline support could suggest that the April and May bounce has run its course.
Nikkei Daily Chart
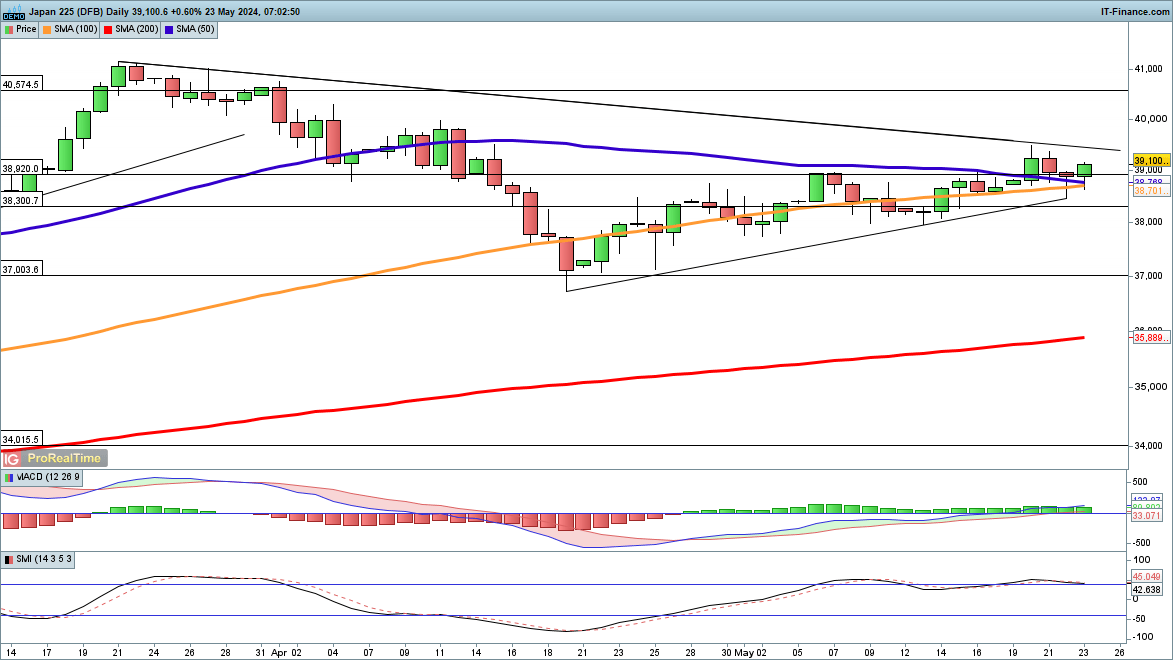
Source: IG, ProRealTime, prepared by Chris Beauchamp