


Dow Jones, S&P 500, Retail Trader Positioning, Technical Analysis – IGCS Equities Update
- The Dow Jones and S&P 500 have been falling recently
- Retail traders responded by increasing long exposure
- Is this a sign that more pain is in store for equities?

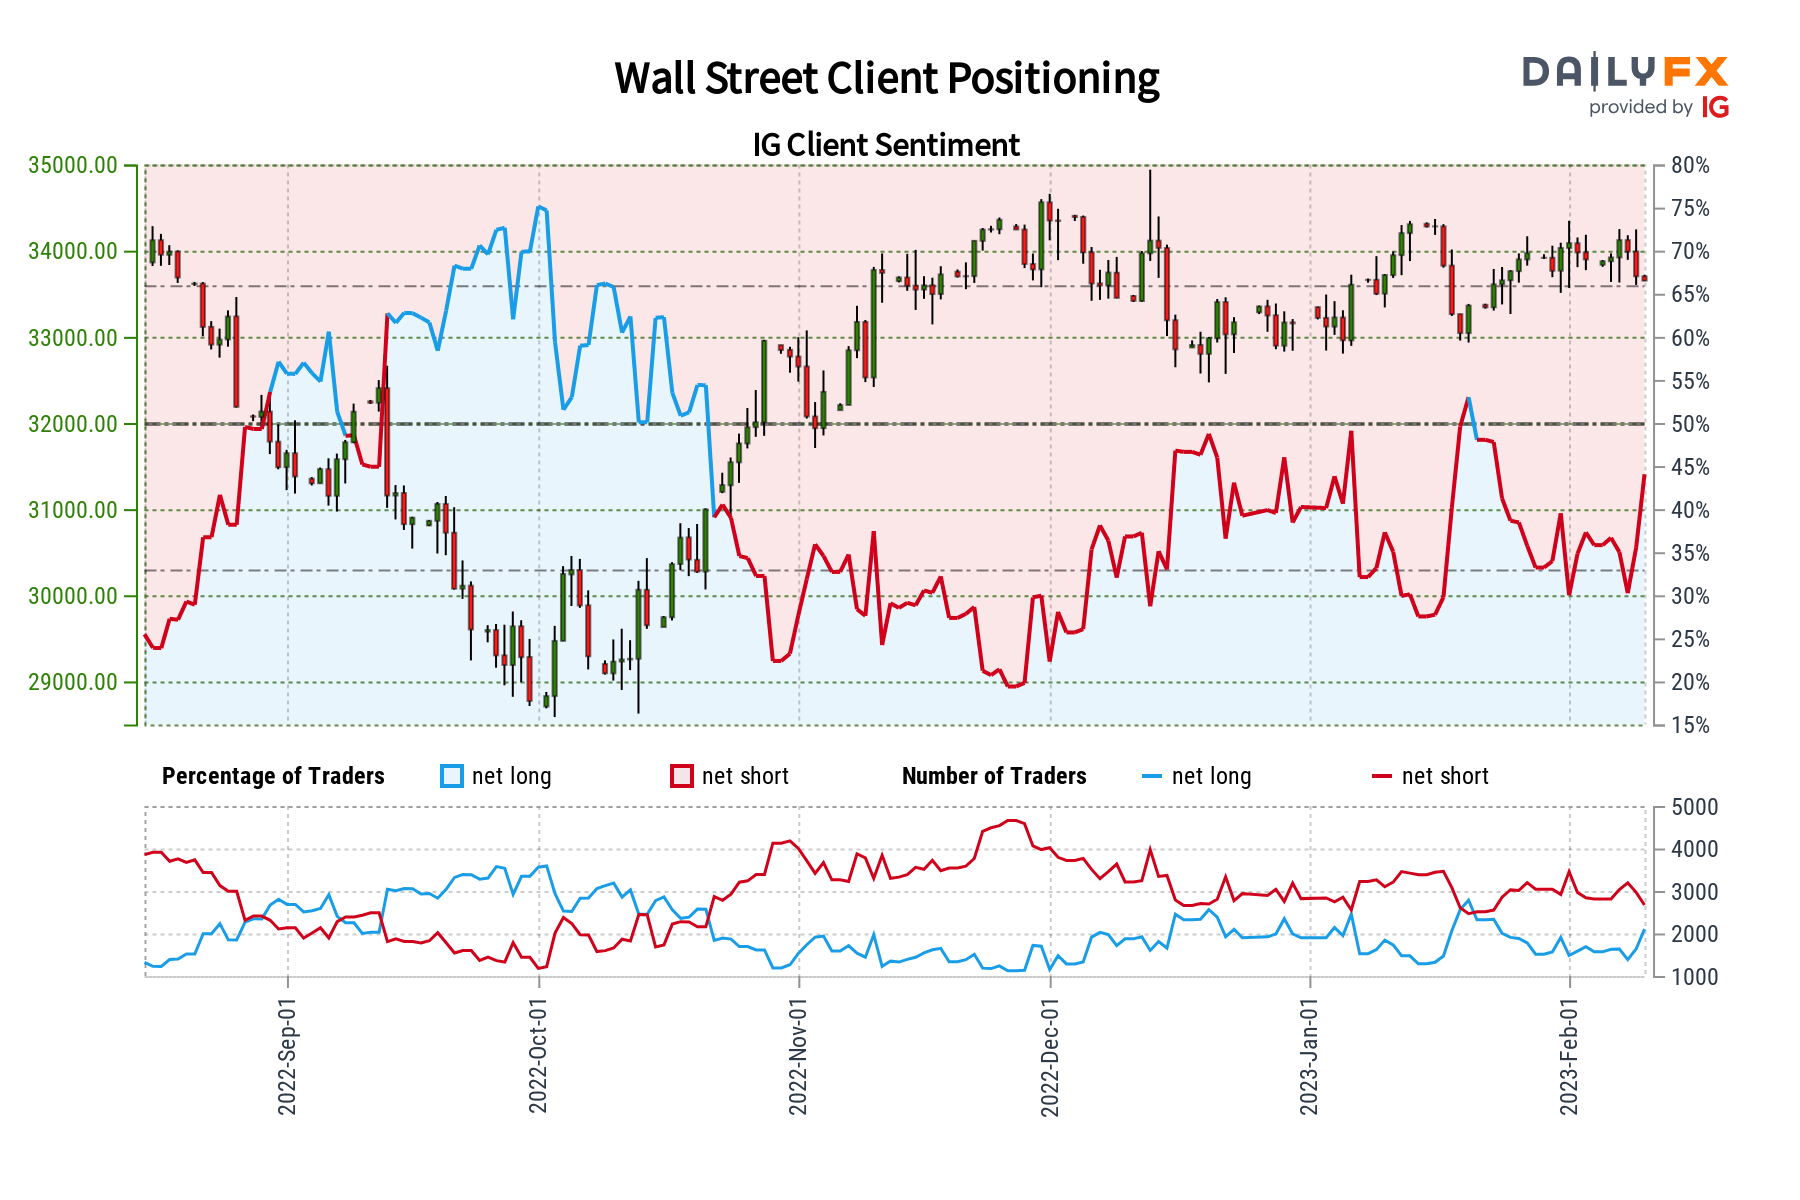
In recent days, the Dow Jones and S&P 500 have been aiming lower. In response, retail traders have been slowly increasing their net-long exposure on Wall Street. This can be seen through the lens of IG Client Sentiment (IGCS), which tends to function as a contrarian indicator. As such, if this trend in positioning continues, further losses may be in store for equities.
Dow Jones Sentiment Outlook - Bearish
According to IGCS, about 44 percent of retail traders are net-long the Dow Jones. Since most traders are net-long, this hints prices may continue rising. However, upside exposure has increased by 30.05% and 27.68% compared to yesterday and last week, respectively. With that in mind, recent changes in exposure hint that prices may soon reverse lower despite overall positioning.
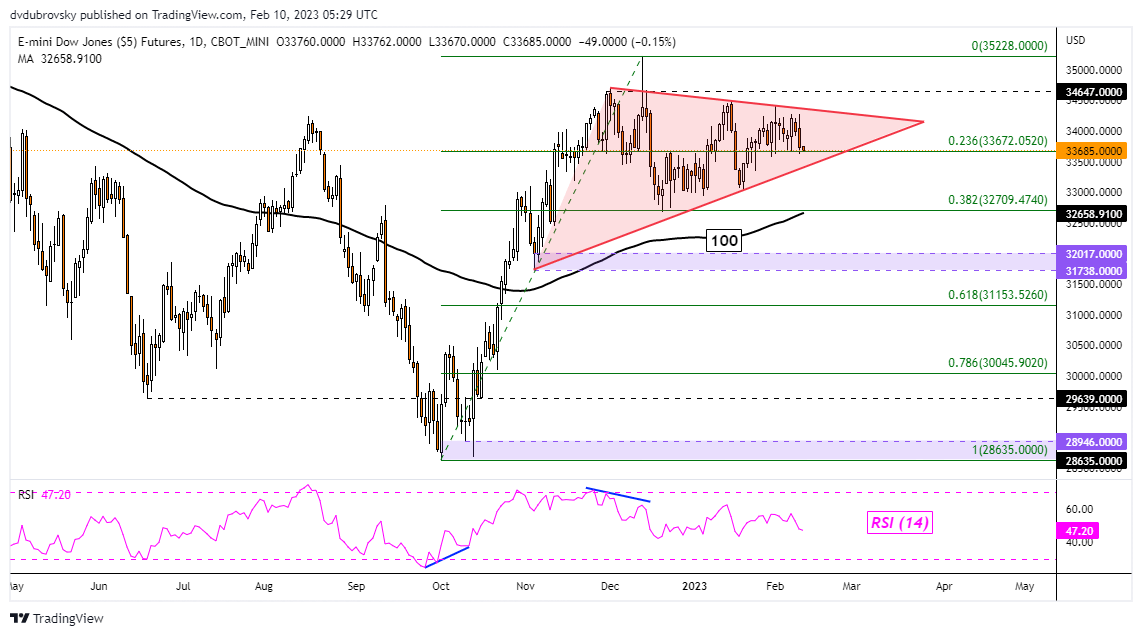
Dow Jones Futures Technical Analysis
On the daily chart, the Dow Jones appears to be consolidating within the boundaries of a Symmetrical Triangle. Prices recently rejected resistance, turning lower towards the rising floor of the chart formation. The direction of the pattern’s breakout could be key for the following trend. Extending losses lower would open the door to resuming the dominant downtrend from last year. That would place the focus on the 100-day Simple Moving Average (SMA).
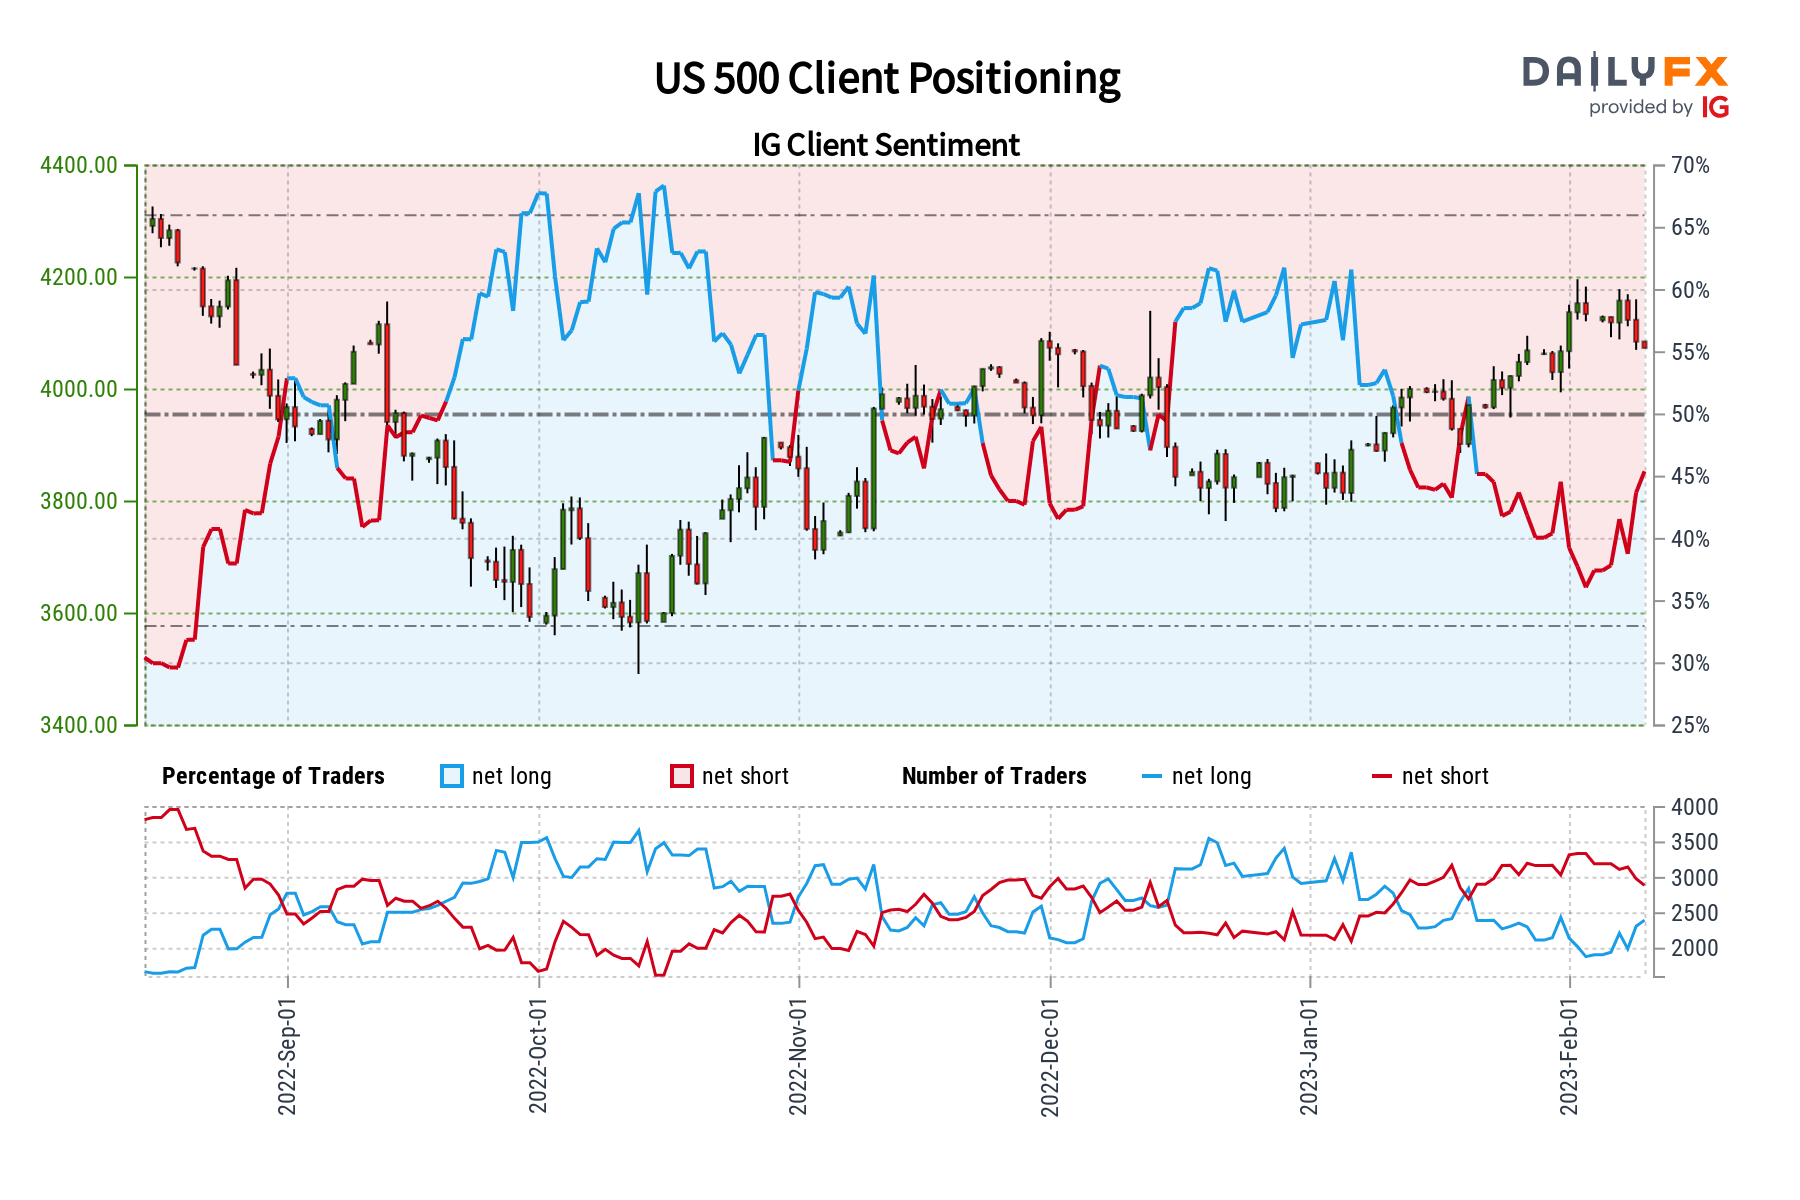
S&P 500 Sentiment Outlook - Bearish
According to IGCS, about 45% of retail traders are net-long the S&P 500. Since most of them are still net-long, this hints prices may continue rising. However, net-long exposure has increased by 4.35% and 26.62% compared to yesterday and last week, respectively. With that in mind, recent changes in positioning warn that prices may reverse lower despite the overall balance of exposure.

S&P 500 Futures Technical Analysis
S&P 500 futures appear to be trading within the confines of a bearish Rising Wedge from October. Recently, prices rejected the ceiling, setting the stage for a retest of the floor of the chart pattern. While the index remains within the wedge, the near-term trend may remain biased higher. However, confirming a breakout would open the door to resuming the dominant downtrend from 2022.

--- Written by Daniel Dubrovsky, Senior Strategist for DailyFX.com
To contact Daniel, follow him on Twitter:@ddubrovskyFX


