


British Pound, GBP/USD, EUR/GBP – Technical Update:
- British Pound makes progress vs USD and EUR
- GBP/USD technical outlook remains bearish
- EUR/GBP still focused on consolidative action

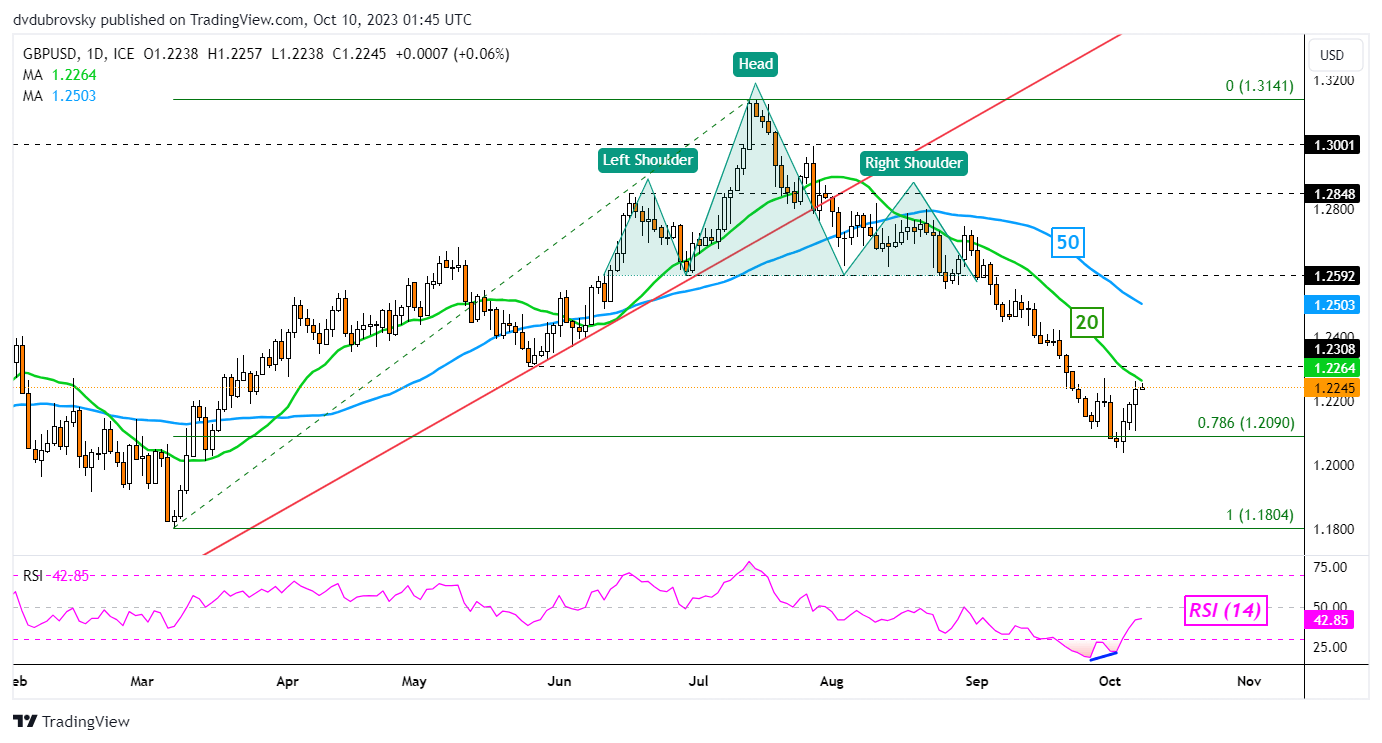
The British Pound has been making upside progress against the US Dollar and Euro. With regards to GBP/USD, the past 3 trading sessions have produced a gain of about 0.9%. This is marking the best 3-day performance since the middle of July. Recent gains have brought Sterling to the edge of the 20-day Moving Average on the daily chart below.
This also followed positive RSI divergence, showing that downside momentum was fading. The moving average may hold, reinstating the broader downside focus. If not, the 50-day could be tested thereafter. As such, while GBP/USD has been pushing higher recently, further progress is needed to offer a bullish technical bias. Clearing under support exposes the March low of 1.1804.

GBP/USD – Daily Chart
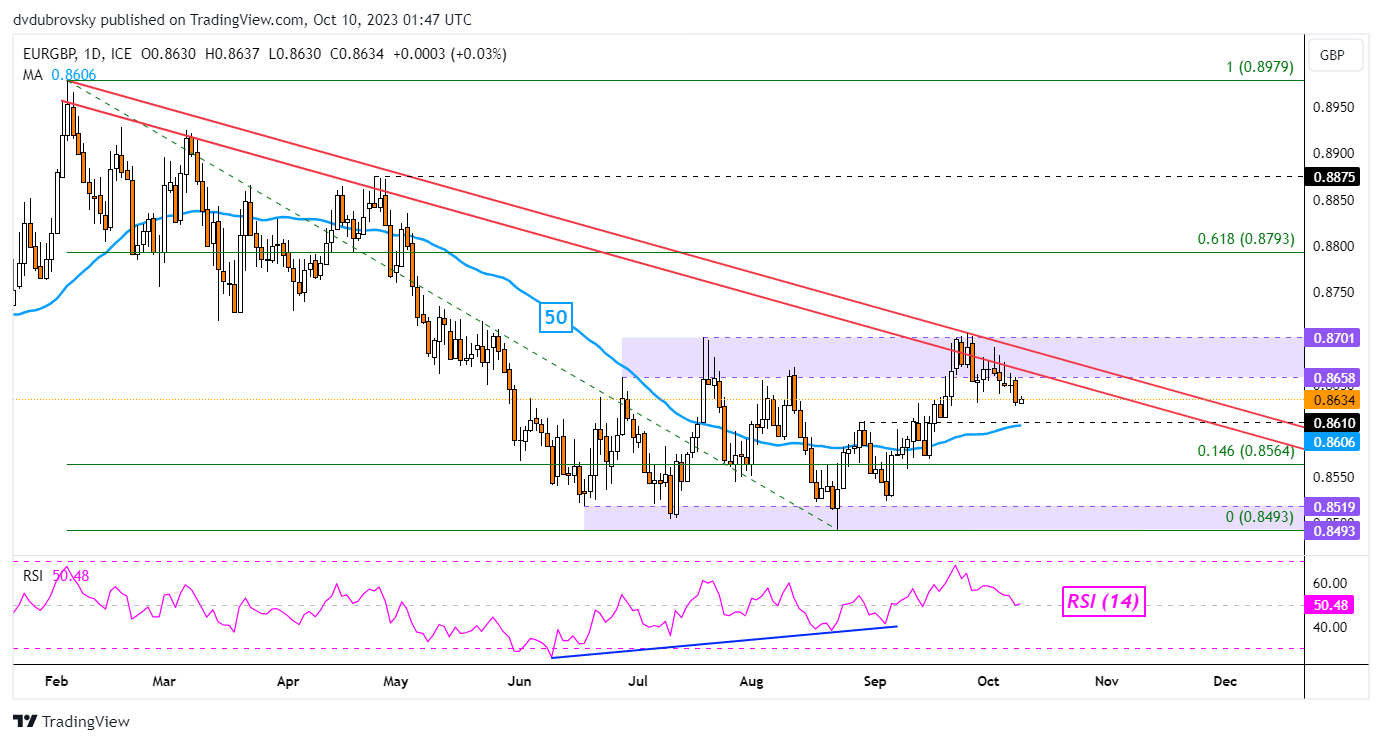
Meanwhile, things are also looking slightly optimistic in EUR/GBP for the British Pound. Recently, prices rejected the 0.8658 – 0.8701 resistance zone, as well as the falling range of resistance from February. This is placing the focus back towards a neutral technical bias where the exchange rate fluctuates between resistance (0.8701 – 0.8658) and support (0.8493 – 0.8519).
Immediate support is a combination of the 50-day moving average and the 0.861 inflection point. Breaking lower places the focus on the minor 14.6% Fibonacci retracement at 0.8564. Breaking under this exposes the zone of support. Otherwise, a bullish technical bias entails clearing the range of resistance, exposing the 61.8% Fibonacci retracement level.
| Change in | Longs | Shorts | OI |
| Daily | 1% | -5% | -2% |
| Weekly | -24% | 37% | 1% |
EUR/GBP – Daily Chart
--- Written by Daniel Dubrovsky, Senior Strategist for DailyFX.com


