


-- Subscribe to Jamie Saettele's distribution list in order to receive a free report to your inbox thrice a week.
Weekly
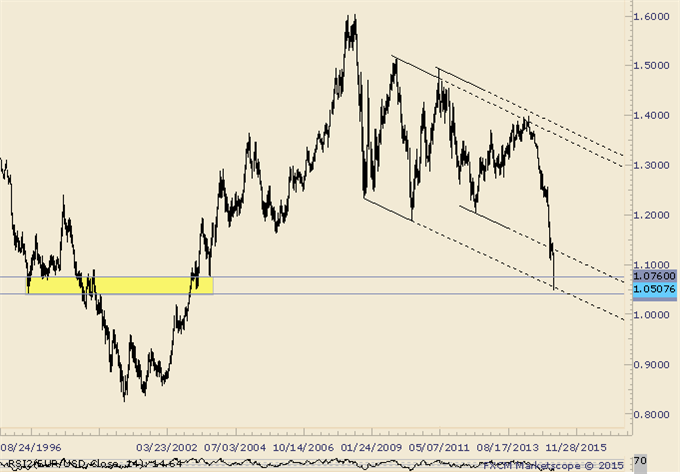
Chart Prepared by Jamie Saettele, CMT using Marketscope 2.0
Automate trades with Mirror Trader
-“BIG picture, monthly RSI has broken out of a triangle pattern. Sometimes, a pattern breakout in momentum (or OBV) precedes the breakout in price. The development’s implications are obviously significant.”
-“There is a long term level to be aware of. The line that extends off of the 2008 and 2010 lows is at about 1.0545 this week. The March 2003 low is at 1.0499.” EURUSD ends the week at 1.05. The next area of long term interest probable isn’t until about .96 (2001 high and Sep 2002 low). Above 1.08 would indicate a behavior change.
Weekly
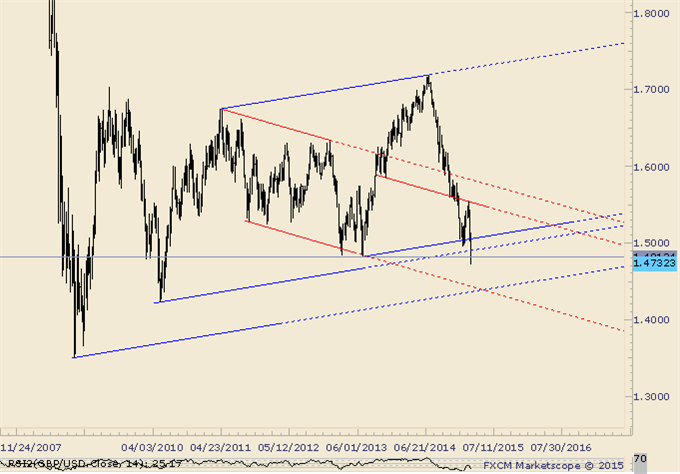
Chart Prepared by Jamie Saettele, CMT using Marketscope 2.0
Automate trades with Mirror Trader
-“A breakout from a 1 month inverse head and shoulders pattern is valid above today’s low (breakout day) but GBPUSD does face channel resistance at this level. The reversal pattern’s objective is 1.5494, which is in line with the December low at 1.5485.”
-“GBPUSD met the target and traded into the mid-1.5500s this week. There is good resistance here from former lows and slopes on multiple time frames. A breakdown towards 1.4250-1.4350 may be underway.” Look towards the mentioned levels as long as price is below 1.5030.
Daily
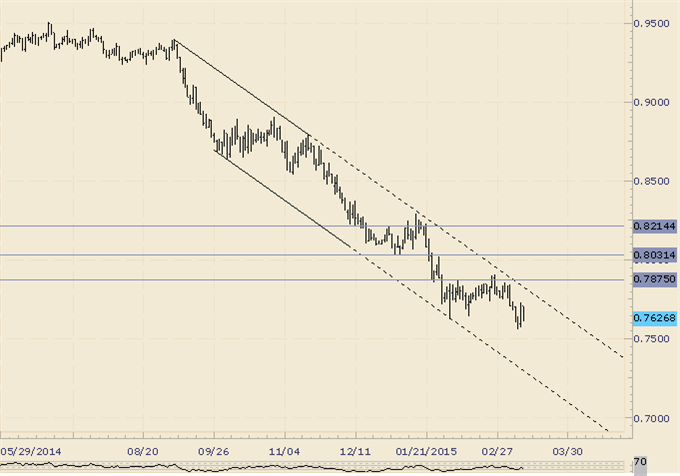
Chart Prepared by Jamie Saettele, CMT using Marketscope 2.0
Automate trades with Mirror Trader
-“Today’s (2/26) reversal comes just shy of channel resistance. As long as price is contained by channel resistance, downside resolution remains possible.” Focus remains on the lower end of the channel in the low .70s but channel resistance must hold. A push above would indicate an important behavior change.
NZD/USD
Weekly
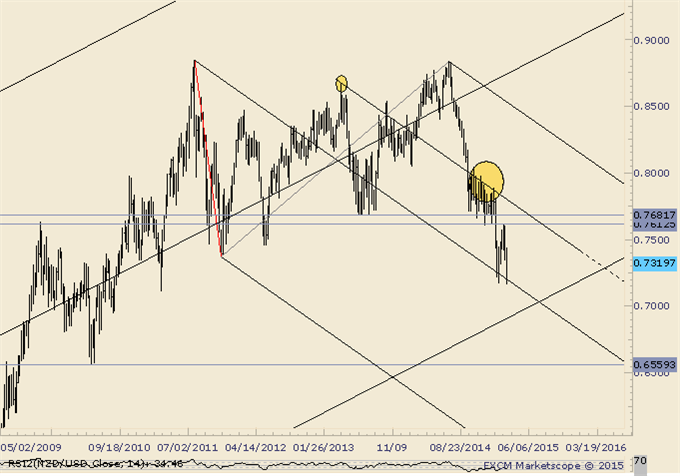
Chart Prepared by Jamie Saettele, CMT using Marketscope 2.0
Automate trades with Mirror Trader
-“NZDUSD traded to the 61.8% retracement of its 3 year range today (.7929) and the next level of interest probably isn’t until the 2013 Labor Day gap at .7722. One can’t help but notice that an epic double top is possible with a target of .5898. That would trigger on a drop below .7370.”
-If the major double top is going to prove successful, then the February high needs to remain in place.
Weekly
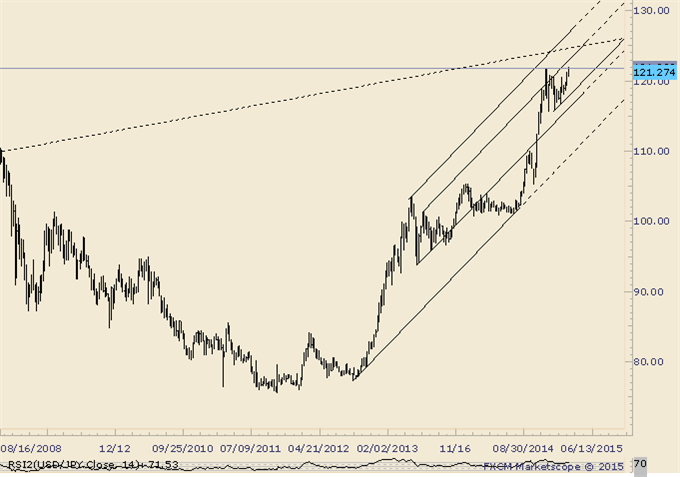
Chart Prepared by Jamie Saettele, CMT using Marketscope 2.0
Automate trades with Mirror Trader
-“Continue to favor a broad range as 119.80-120.70 as resistance and 116.40-117.10 as support. A move through either one of these zones would define target zones of 124-128 and 110-114.”
-USDJPY is flirting with a breakout from the cited resistance zone (120.70). The next area of interest on the upside would be 123.16-124.13. A daily close below 119.50 would indicate a reversal.
Weekly
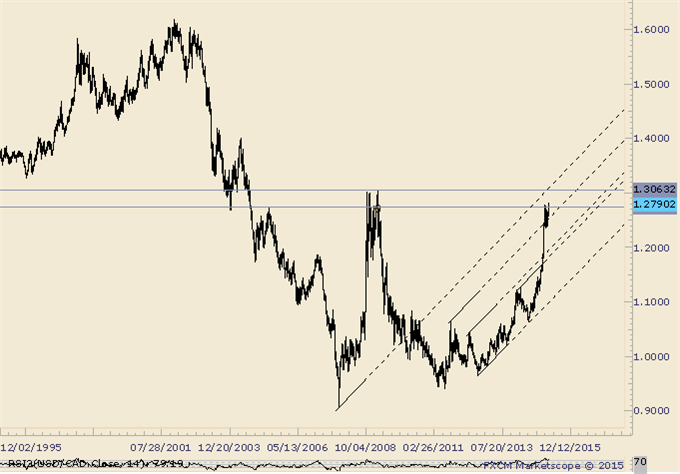
Chart Prepared by Jamie Saettele, CMT using Marketscope 2.0
Automate trades with Mirror Trader
-“The contracting range indicates potential for a triangle from the high. Typically, a triangle will lead to a thrust in the direction of the preceding trend.” Triangle targets are 1.3074 and 1.3245. If the path is still higher, then former triangle resistance should provide support if reached (about 1.2550).
USD/CHF
Monthly
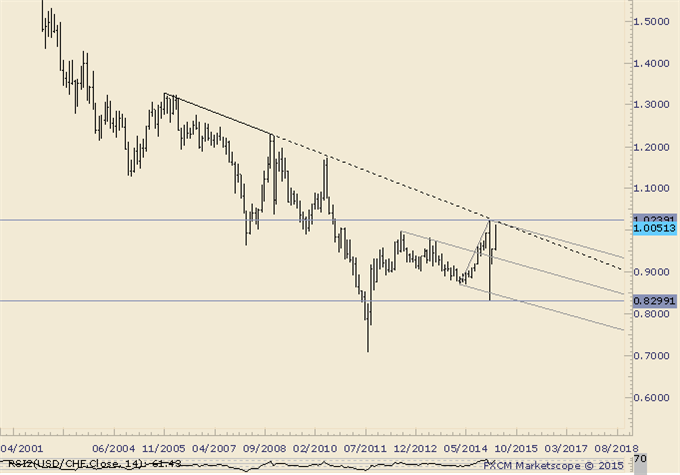
Chart Prepared by Jamie Saettele, CMT using Marketscope 2.0
Automate trades with Mirror Trader
-“USDCHF has retraced nearly the entire SNB fiasco and returned to the year open price. This level is also the 2012 high. A confluence of such important prices (year and open and a former yearly high) is often decent support/resistance so a break through this would major. The median line remains estimated support near .9300.” An upper parallel is all that remains as possible resistance before the high.


