Talking Points:
- US Dollar Remains in Consolidation Mode Near April Bottom
- S&P 500 Continues to Struggle with Breaching February High
- Gold Still Treading Water, Crude Oil Declines to 2-Week Low
Can’t access the Dow Jones FXCM US Dollar Index? Try the USD basket on Mirror Trader. **
US DOLLAR TECHNICAL ANALYSIS – Prices continue to drift sideways in consolidation mode above April’s swing bottom. A daily close below the 11736-7 area (February 6 low, 38.2% Fibonacci expansion) exposes the 50% level at 11688. Alternatively, a push above the 23.6% Fib retracement at 11839 opens the door for a challenge of the 38.2% threshold at 11901.
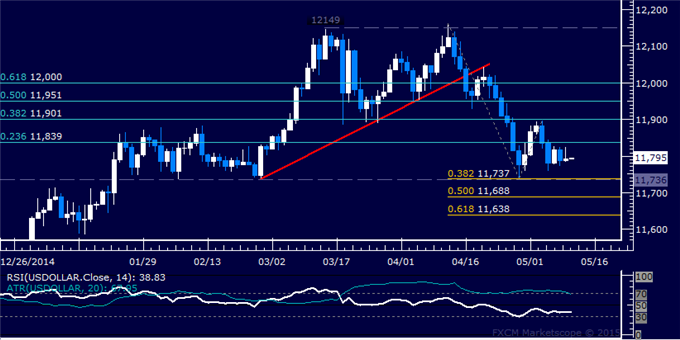
Daily Chart - Created Using FXCM Marketscope
** The Dow Jones FXCM US Dollar Index and the Mirror Trader USD basket are not the same product.
S&P 500 TECHNICAL ANALYSIS – Prices are cautiously attempting to edge lower as expected after putting in a Bearish Engulfing candlestick pattern, warning that a double top may be taking shape. A break below the 38.2% Fibonacci retracement at 2065.70 exposes the 50% level at 2047.10. Key resistance remains at 2119.40, the February 25 high.

Daily Chart - Created Using FXCM Marketscope
GOLD TECHNICAL ANALYSIS – Prices continue to oscillate in a choppy range around the $1200/oz figure. A break below range support at 1178.09 exposes the 38.2% Fibonacci expansion at 1161.16. Range resistance remains at 1214.64.

Daily Chart - Created Using FXCM Marketscope
CRUDE OIL TECHNICAL ANALYSIS – Prices turned lower as expected after putting in a Shooting Star candlestick. From here, a break below the 38.2% Fibonacci retracement at 63.08 exposes the 50% level at 61.07. Alternatively, a rebound above the 23.6% Fib at 65.57 targets the 14.6% retracement at 67.10.

Daily Chart - Created Using FXCM Marketscope
--- Written by Ilya Spivak, Currency Strategist for DailyFX.com
To receive Ilya's analysis directly via email, please SIGN UP HERE
Contact and follow Ilya on Twitter: @IlyaSpivak