


Talking Points:
- US Dollar Issues Largest Daily Decline in Over a Month
- S&P 500 Continues to Warn of Double Top in the Works
- Crude Oil in Digestion Mode, Gold Eyeing Monthly Top
Can’t access the Dow Jones FXCM US Dollar Index? Try the USD basket on Mirror Trader. **
US DOLLAR TECHNICAL ANALYSIS – Prices continue to correct downward, sliding to the weakest level in two months. A daily close below the 100% Fibonacci expansion at 11809 exposes the 123.6% level at 11754. Alternatively, a move above the 76.4% Fib at 11864 opens the door for a challenge of the 61.8% expansion at 11899.
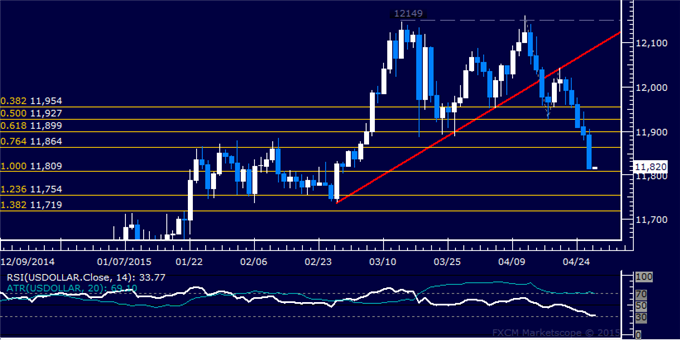
Daily Chart - Created Using FXCM Marketscope
** The Dow Jones FXCM US Dollar Index and the Mirror Trader USD basket are not the same product.
S&P 500 TECHNICAL ANALYSIS – Prices put in a Bearish Engulfing candlestick pattern, suggesting a double top may be taking shape at 2119.40 (February 25 high). Negative RSI divergence bolsters the case for a downside scenario. A break below trend line resistance-turned-support at 2108.50 exposes the 38.2% Fibonacci retracement at 2093.50.
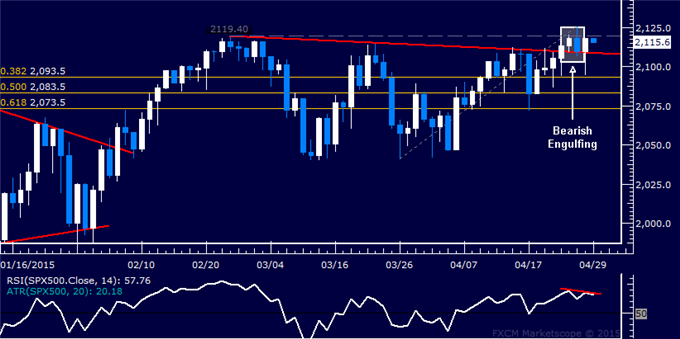
Daily Chart - Created Using FXCM Marketscope
GOLD TECHNICAL ANALYSIS – Prices are attempting to build upward anew after reclaiming a foothold above the $1200/oz figure. A break above the 50% Fibonacci expansion at 1215.88 exposes the 61.8% level at 1225.50. Alternatively, a move below the 38.2% Fib at 1206.26 targets the 23.6% expansion at 1194.35.
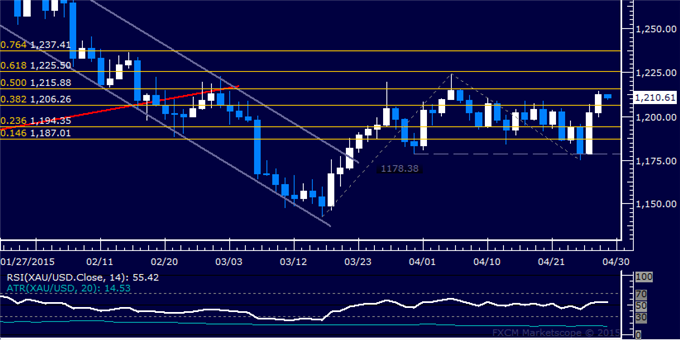
Daily Chart - Created Using FXCM Marketscope
CRUDE OIL TECHNICAL ANALYSIS – Prices are in digestion mode after rising to the highest level in over four months. A daily close below the 63.56-73 area (61.8% Fib, April 16 close) targets the 50% Fibonacci expansion at 61.46. Alternatively, a push above the 76.4% level at 66.16 exposes the 100% Fib at 70.36.
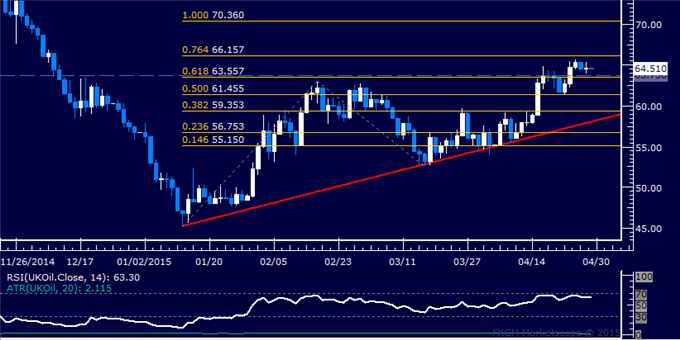
Daily Chart - Created Using FXCM Marketscope
--- Written by Ilya Spivak, Currency Strategist for DailyFX.com
To receive Ilya's analysis directly via email, please SIGN UP HERE
Contact and follow Ilya on Twitter: @IlyaSpivak


