


A forex pivot point strategy could very well be a trader’s best friend as far as identifying levels to develop a bias, place stops and identify potential profit targets for a trade.
Pivot points have been a go-to for traders for decades. The basis of pivot points is such that price will often move relative to a previous limit, and unless an outside force causes the price to do so, price should stop near a prior extreme. Pivot point trading strategies vary which makes it a versatile tool for forex traders.
Keep reading to learn more about:
- Defining the pivot point
- How to calculate pivot points
- Using pivot points in forex trading
- Pivot point trading strategies
- Difference between pivot points and Fibonacci retracements

What is a pivot point?
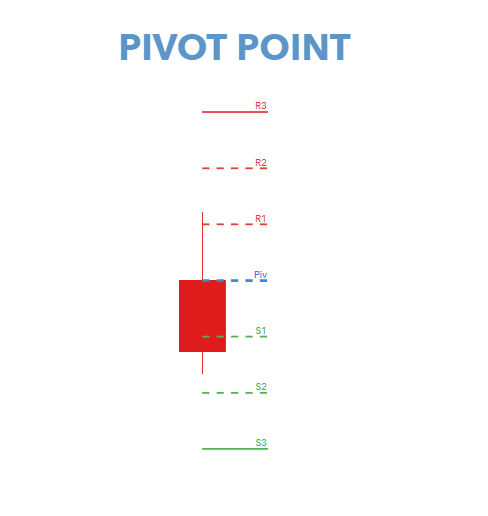
A pivot point is a is a technical indicator used by forex traders as a price level gauge for potential future market movements. The pivot point indicator is used to determine trend bias as well as levels of support and resistance, which in turn can be used as profit targets, stop losses, entries and exits.
Pivot point example:
How to calculate pivot points
The calculation for the most basic flavor of pivot points, known as ‘floor-trader pivots,’ along with their support and resistance levels:
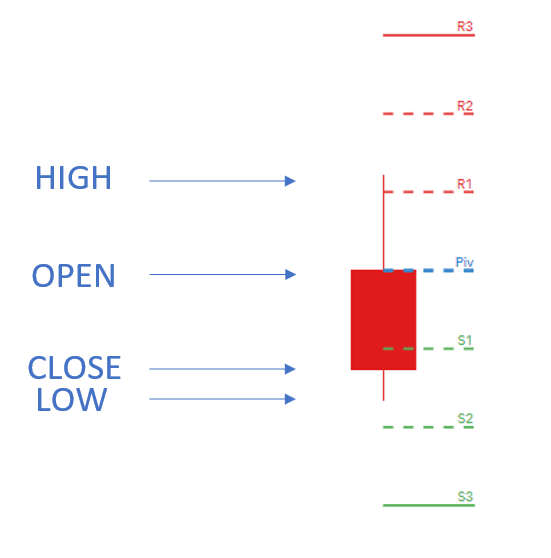
Pivot point formula
Pivot point (PP) = (High + Low + Close) / 3
First resistance (R1) = (2 x PP) – Low
First support (S1) = (2 x PP) – High
Second resistance (R2) = PP + (High – Low)
Second support (S2) = PP – (High – Low)
Third resistance (R3) = High + 2 (PP – Low)
Third support (S3) = Low – 2 (High – PP)
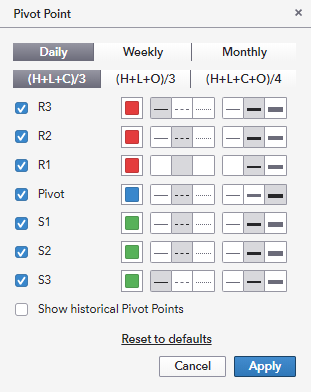
There are other ways to calculate the pivot point, which is available on most trading platforms and can be extended through different time frames. The support and resistance levels will be calculated as above. Below is an example of what is offered on the IG trading platform for daily pivots. The same calculation can be made for weekly or monthly pivots too:
How did the pivot point calculation come about?
Up until recently, computers were not available on a mass scale. Therefore, market makers and floor traders needed a way of determining whether price was ‘cheap’ or ‘expensive’ on a relative basis. From a simple mathematical calculation, pivot points were born.
Traders simply took the high, low, and closing price from the previous period and divided by three to find the ‘pivot.’ From this pivot, traders would then base their calculations for three support, and three resistance levels.
How to use pivot points in forex trading
Pivot points are used by forex traders in line with traditional support and resistance trading techniques. Price tends to respect these levels as they do with support and resistance. Pivot point price levels are recurrently tested which further substantiates these levels.
Traders frequently use additional validation tools such as indicators, candlestick patterns, oscillators, fundamentals and price action to use in conjunction with the pivot to make trade decisions in the forex market.
There are a few basic guidelines to follow when trading with pivot points:
- Price above pivot = bullish bias
- Price below pivot = bearish bias
- Longer period pivot points are more dependable due to increased data set
- Support and resistance levels are extensions of the pivot which can be used as supplementary key price levels
Pivot Point trading strategies
1. Pivot point swing trading
For traders who prefer the medium to longer-term trades, swing trading with the pivot point is possible by using weekly/monthly time frames.
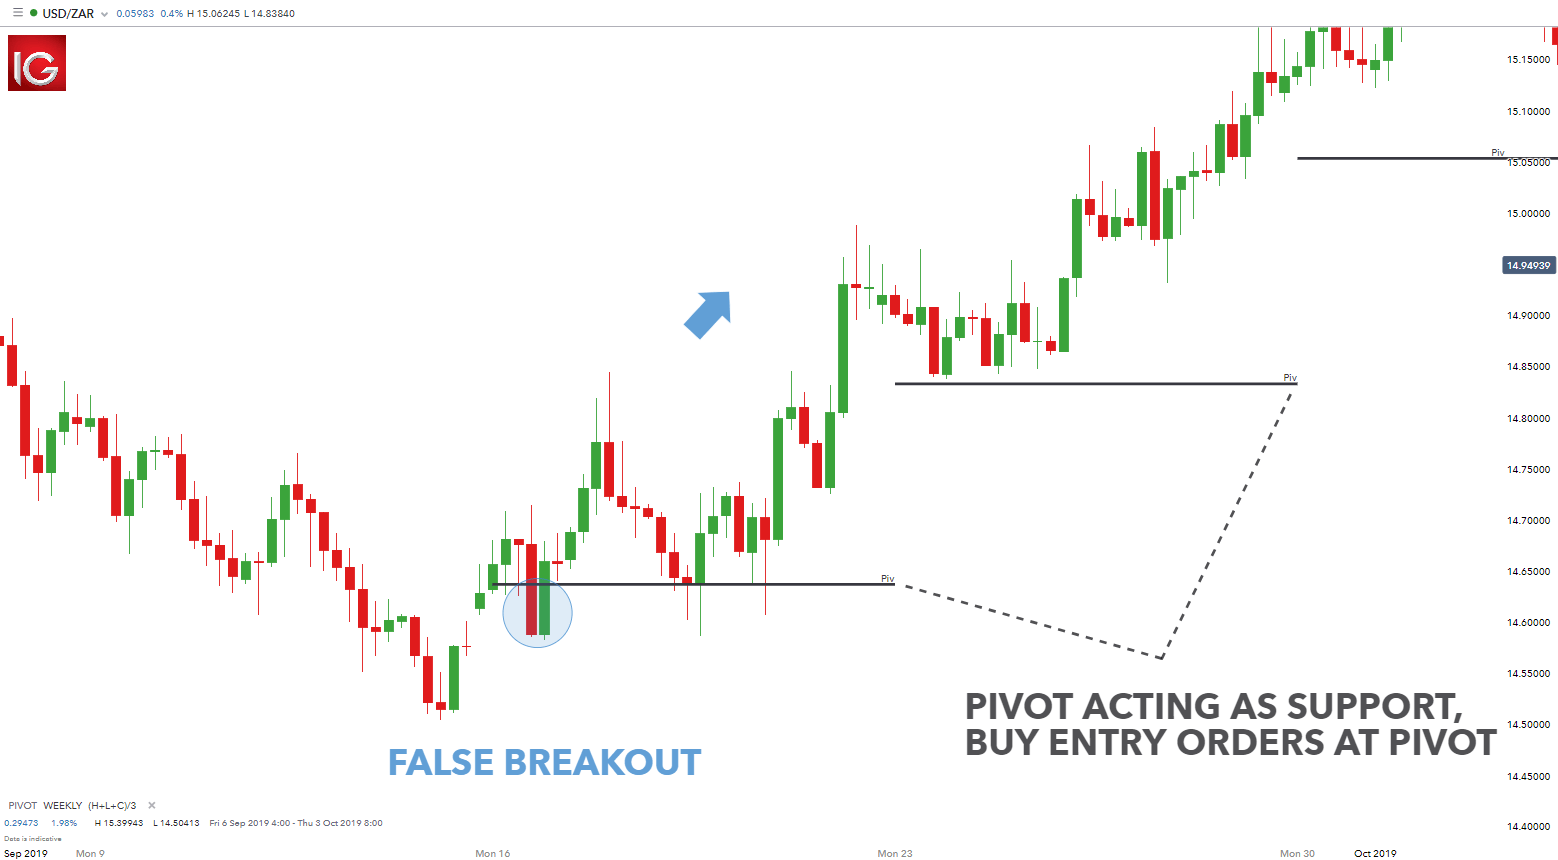
The chart below depicts a weekly chart with the addition of the pivot point only (this can be edited by changing the pivot settings on the platform). It is clear there has been a trend reversal to the upside which is evident after the price breaks through the previous pivot resistance.
Now acting as a support level, forex traders can place long entry orders at the pivot price. There is a false breakout (blue circle) but after this, there is substantial upside which could be exploited. The pivot levels won’t always contain the price, but it does offer a price level to maintain the directional bias. This would be a lengthier time horizon which would be ideal for swing traders.
USD/ZAR weekly chart
2. Pivot point breakout strategy
Many traders attempt to focus their trading activity to the more volatile periods in the market when the potential for large moves may be elevated.
Traders may attempt to look at breaks of each support or resistance level as an opportunity to enter a trade in a fast-moving market. This can be particularly relevant for longer-term pivot levels, with focus being paid to the weekly and monthly pivot points. The charts below will show how a trader can set up a pivot point breakout strategy using firstly the pivot alone as an indication as well as the more complex support and resistance levels.
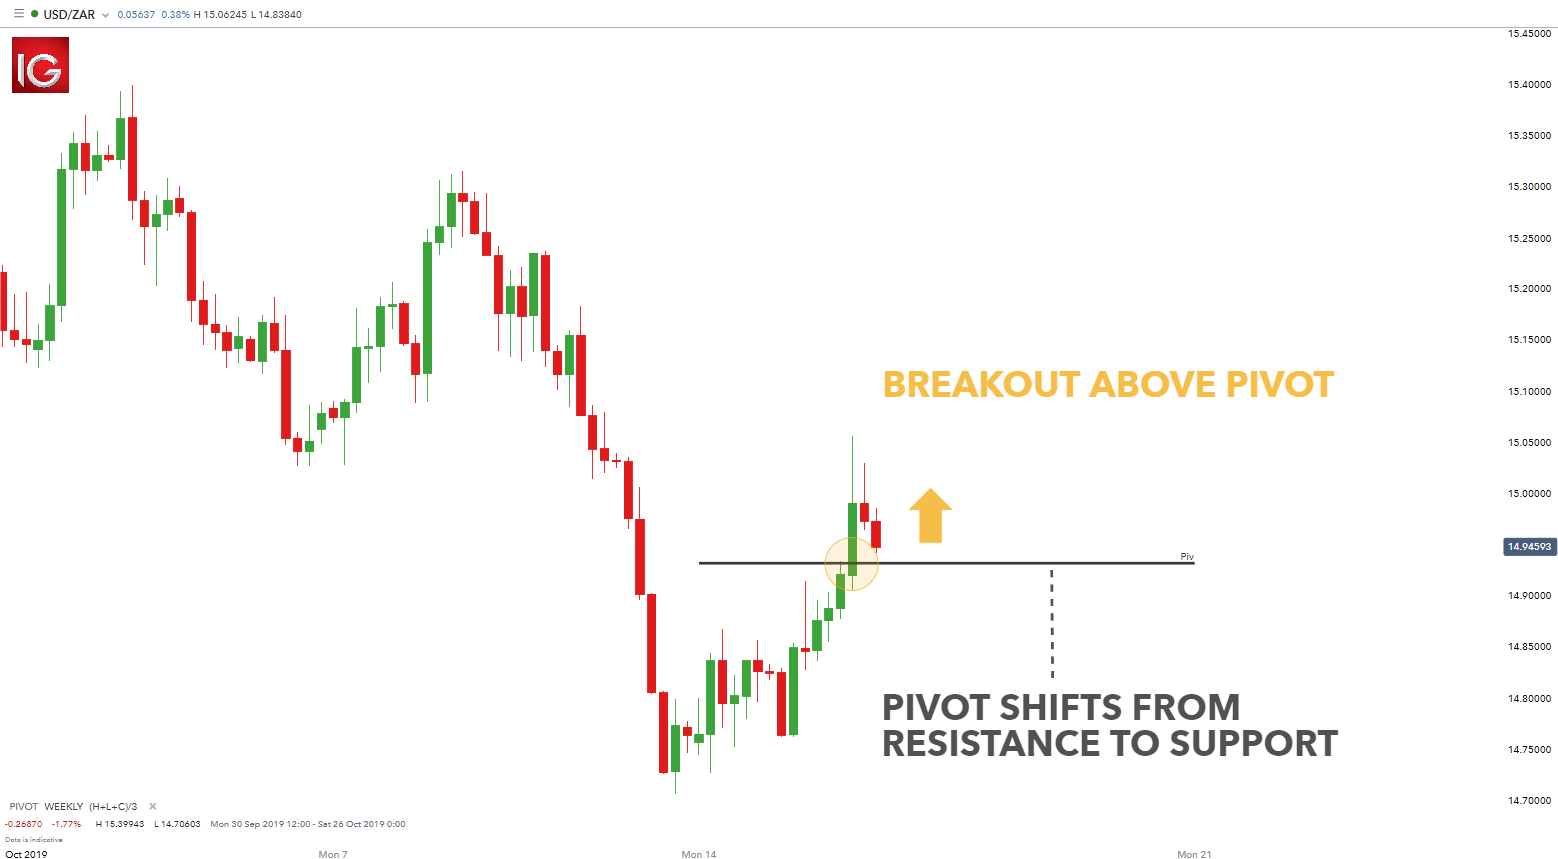
The chart below shows a pivot point with support and resistance levels excluded. In this example, the pivot indicator is based over a weekly period which provides traders with an extended data set for a more reliable key level. The pivot is used as a key price level, which was initially respected a few candles prior to the breakout. Once the breakout occurs, traders can then look to enter into a long trade as price above the pivot signals a bullish bias.
USD/ZAR four-hour chart
What’s the difference between pivot points and Fibonacci retracements/extensions?
Both pivot points and Fibonacci retracements/extensions present traders with hidden levels of support and resistance. However, there are some significant differences:
| Pivot points | Fibonacci retracements/extensions |
|---|---|
| Calculated as the average of the previous periods high, low and close | Based on fixed ratios as a result of the Fibonacci sequence |
| Based on previous period price extremes | Based on previous waves price extreme |
Further reading on pivot points
- Learn the basics of the classic pivot, with our guide to floor trader pivots.
- Get to grips with trading with support and resistance to build the groundwork for basic support and resistance practices.
- Use our hourly, daily, weekly and monthly pivot points to determine market sentiment in forex and other key assets.