


Talking Points
- SSI is a positioning tool gauging market sentiment.
- SSI can help gauge strong market trends.
- The GBPUSD has reached an extreme negative reading to start December trading.
SSI (Speculative Sentiment Index) is a proprietary trading tool to FXCM, offered to its clients through DailyFX PLUS. SSi is used to determine trading positioning, and once you are familiarized with the indicator it can be used to confirm trend on Forex pairs and CFD contracts. Currently the GBPUSD is reading an extreme -4.29. Today we will review exactly what this may mean for the last month of the 2013 trading year.
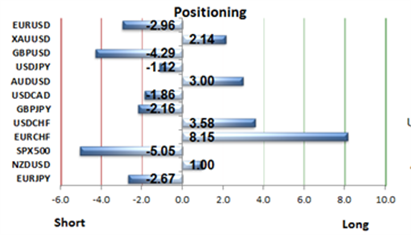
Learn Forex – Current SSI Readings
SSI and the Pound
As of this morning we can see in the chart above that the SSI reading for the GBPUSD has reached an extreme reading of -4.29. As the number reads negative, this means more positions are over 4 times the amount of short interest on the GBPUSD relative to long positioning.
The main reason that the SSI reading has reached these extreme levels is primarily due to the currency pair’s strong trend. Below you can see the GBPUSD trending as much as 1692 pips higher from Julys low through this week’s high. As most traders attempt to fade strong trends, SSI has become more negative as the pair continues to trade towards higher highs.
Learn Forex – GBPUSD Daily Trend
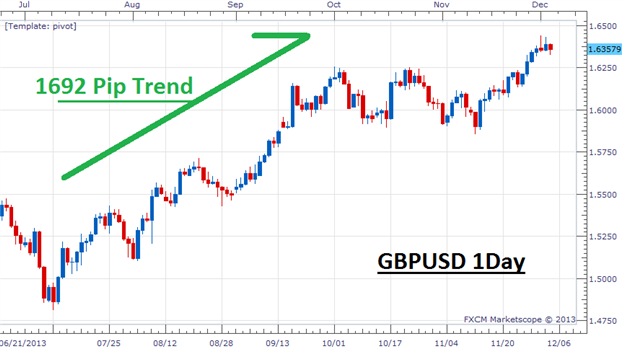
(Created using FXCM’s Marketscope 2.0 charts)
Trading the GBPUSD
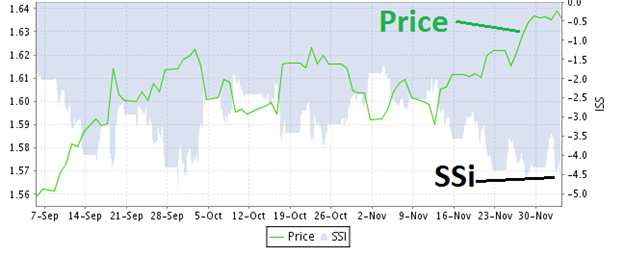
Below we can see the price of the GBPUSD over time relative to its SSI reading. Putting both aspects together give the trader a clear idea of how they operate in tandem. Knowing this, traders should look to continue to find opportunities to buy the GBPUSD as interest remains extremely negative.
As with any component in an existing trading plan, SSI should be continually monitored. This can be done through DailyFX PLUS where it is updated twice daily. If position continues to be largely net short, then this can be taken as a confirmation to the continuation of the current downtrend. Conversely, if SSI begins to advance and net short interest declines this could be taken as a signal that the current uptrend in the GBPUSD is at least temporarily coming to a pause.
---Written by Walker England, Trading Instructor
To contact Walker, email instructor@dailyfx.com. Follow me on Twitter at @WEnglandFX.
To be added to Walker’s e-mail distribution list, CLICK HERE and enter in your email information.
Become a Smarter Trader Today
Claim your FREE universal membership to DailyFX Internet Courses & save yourself hours in figuring out what FOREX trading is all about.
You'll get this FREE 20 minute “New to FX” course presented by DailyFX Education. In the course, you will learn about the basics of a FOREX transaction, what leverage is, and how to determine an appropriate amount of leverage for your trading.
You can instantly register for free here to start your FOREX learning now!


